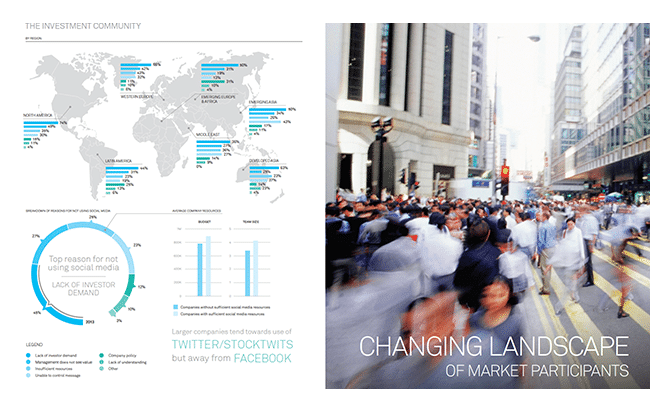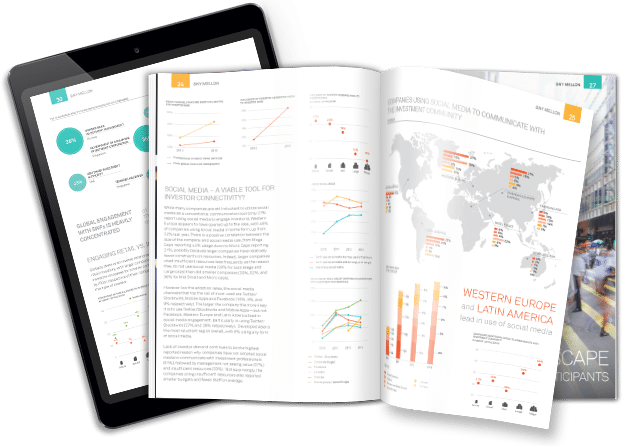
There’s certain time of year when last year’s data has to be assessed. Every year, many organizations create an annual report to demonstrate the previous year’s performance. These annual reports are more than just a record of data analytics, they’re a catalyst for change.
What does a report do?
Annual reports are used to present company data to shareholders. Most reports will outline corporate information such as finances, market research, and other performance related details. The report includes analytics to highlight the business narrative.
- What were the profit margins and why did it change?
- Why does the company need venture capital and how will it affect performance?
- Which demographic fields are valuable/unresponsive?
- What internal decisions need to be made
The insights are the star of the report, but the real prize comes afterwards. Based on the collection of key insights, decision-making will change.
- What/who performed well?
- What strategies didn’t work?
- Should the budget/funding change?
- Are there new insights that require new efforts/campaigns/policies?
And in its simplest role, an annual report provides information to the audience.
Data visualization
It might not be the first you think of when it comes to data visualization, but reports are a form of data visualization. While some reports aren’t meant to be visually engaging, there’s always an element of design that should be considered. Just like a website or dashboard, a report must be well designed to guide and encourage audience understanding.
 How do you present the information (both text and image) in an intuitive way that can be easily understood by someone unfamiliar with the data? If the design is too confusing, you might not get the budget you want for next year because the board doesn’t why you need it. A campaign may have been successful in unearthing an unexpected insight, but if executives don’t understand why that’s significant, it won’t be supported going forward.
Annual Reports for every industry helps us all
In addition to annual reporting, specific industries and markets have an in-depth reports that combine data from different sources. These consolidated data sets enable collaboration and opens the door to better opportunity for change. Reports aren’t just for internal use either. Reports bring forth important context and details that are otherwise overlooked in raw data form. Reporting isn’t just about packaging readable data, it’s also about driving change and decisions. Looking at a data set won’t provide data context right away and the intended audience probably won’t analyze every bit of data themselves. Which is why the presentation of data matters. If you’re familiar with data analytics and insights, you’ll know you don’t get all the details in the big picture. Reports don’t confine your data to one page or just one image, making it the perfect way to display key details and enable data accessibility.
- The location-based marketing industry has a report that predicts 94% industry growth based on survey data. This spells incredible opportunity for many businesses and marketers who decide to shift the directions of internal operations.
- Very recently, the Seafood Certification and Ratings Collaboration consolidated data from the 5 leading seafood sustainability NGOs and released an industry report (for the first time). The report makes it easier to collaborate on crucial issues and efficiently combine tools so the impact of sustainability is greater.
- A recent report (using data from the US Census Bureau) indicated that the number of children living in poverty decreased from 22% in 2010 to 18% in 2017. That’s undeniably good news, but what the data as a whole does not reveal is dangerous to certain children. The report organized Census data to reveal less feel-good facts. The number of child and teen deaths remained unchanged and racial disparities especially did not improve.
These insights presented in an easy-to-understand report will affect funding allocation, public awareness, public policy, and more. These are the decisions that affect us within a business, country, and even on a global scale.
So, what does your annual report look like?
