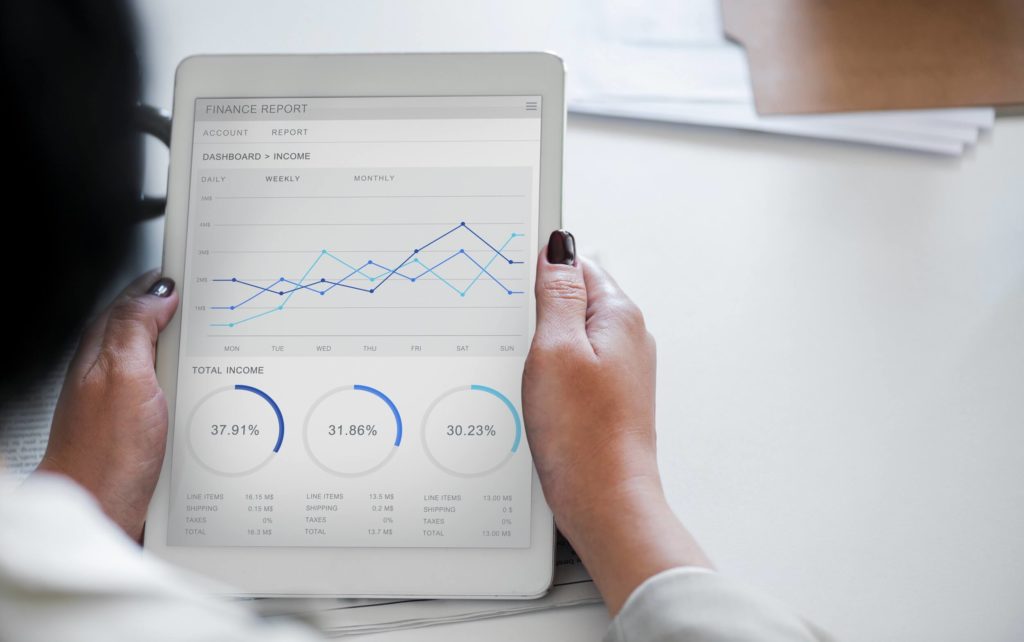
Any business that knows how to maintain consistent performance and successfully scale growth knows the importance of leveraging data. Tracking data through key metrics equips businesses with the insights they need to implement effective change. Sometimes, businesses get lucky and see quick success, but luck isn’t data and it won’t give you the informational means to carry the weight of operations long term. Truly successful businesses know how their efforts translate wins or losses by leveraging data and you should too.
What should I analyze for better business?
No matter how business is, it’s imperative you track both external and internal data. Clients and customers provide metrics for sales figures, geography, audience segments, marketing, and more. These metrics represent external performance that will be used to influence decisions. How much was spent on the new ad campaign and how much new business did it bring? Where does the target demographic live?
Internally, figure out how efficiently teams utilize time and resources. Do you need to invest in better tools to save time and frustration in the long run? Does the team have the expertise they need to move forward? How much money and time is spent for X amount of ROI? Do you need more resources, staff, or expertise? What could streamline the process or improve teamwork? What does X amount of hours accomplish in revenue?
Knowing “how” and “why” means you’ll be able to make effective decisions.
How do I set KPI targets? Benchmarks?
How do you choose a reasonable and attainable KPI target? Do an analysis of historic data and track the progress made over time. How did the company perform in the past? What is the difference over the years? What changes in ads/investment/popularity affect the metrics? What resources do you currently have, what is needed to reach the goal, and is that possible within the time frame?
For example, one of the most common KPI’s is revenue, but just marking a goal doesn’t give a whole lot of context. Think of it like you’re building a case file by investigating and collecting details:
- Profits by month/quarter/year, past and current
- Budget spent on campaigns/resources compared to profit to calculate ROI
- Web traffic by clicks/location/landing pages compared to lead generation
- Investment into staff/tools/services
If past data showed revenue was low during summer months and high ad spend didn’t have much impact on sales during the season, summer budgeting could be different moving forward. New SEO content brought a 30% traffic increase to a specific landing page and generated leads. The average annual profit trajectory shows an overall increase of 3% each year. These are the insights that will allocate budgets by season or hire new professionals to boost performance. KPI targets are great guidelines to stay on track, not rigid goals that spell doom if they aren’t fulfilled. Business can be unpredictable, so staying on top of data means companies can easily adapt to new insights.
Benchmarking is the evaluation of business processes in relation to a peer business and can be a good tool for some, but only with a lot of consideration. Benchmarking itself is another separate procedure that requires more analytics and perspective for comparison. Industry best practices aren’t a universal standard, but they are good examples of what other businesses measure and find successful. Comparisons can unearth new insights that contrast with your business’s internal performance, leading you towards better planning and calibration. Benchmarking isn’t right for every business, but it’s added analytics for those that do use the process.
Keep going with data and insights
There’s no defined end to data analytics. Keep leveraging data and you’ll know the ins and outs of your business for better decision-making, growth, and success.
