
How are artificial intelligence and data visualization connected? It’s the data. Data is everything to AI, in both creating and teaching it. Intelligent machines, like a humanoid robot that doesn’t laugh at dad jokes, are heavily based on data. They are fed specialized algorithms to facilitate deep machine learning. They are also designed to respond while simultaneously processing every new piece of information for predictive analysis.
Consider AlphaGo, an AI computer designed by DeepMind to play the very complex game of Go, which went on to beat Lee Sedol, one of the best human Go players in the world.

Reaction based AI behaves the same way by using data collected from interactions to relay the most appropriate responses. Lee Sedol was able to beat AlphaGo in one game because the AI system predicted the odds of a particular move was too low.
On a more common scale, AI systems behave similarly to data analysts. Both use incoming and aggregate data to predict and make decisions. Things like tracking customer behavior, transactions, performance, etc. are widely used by retail companies, banks, and more. Many businesses have been using AI systems to handles large customer bases for customer service and marketing. And data visualization can help.
So how is data visualization relevant to Artificial Intelligence?
Something as common as a talking camera app or self-checkout lane with an interactive interface are both forms of AI. Machine learning can monitor cameras to look for thieves, but it won’t design those buttons on the screen for you. And even though the technology collects data for you, there’s just too much and you can’t read everything line by line.
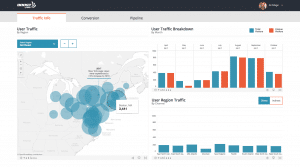 That’s where you need people. Designers create custom interfaces for you specific needs and commands, as well as custom dashboards that show easy to read metrics. Data visualization makes things easier where the AI can’t. You need to organize data for application, especially with data mining. How else can you make sense of the information?
No matter much AI breaks down human behavior by numbers, there are things that it can’t account for. Self-driving cars, though praised as the future of driving, have had a few accidents (including a death). The AI can’t defend its investments or convince regulators to be receptive. These are things that people have to do and can only be effectively done with data and data visualization. Use an infographic to display statistical facts that show promise or a report to show investors that the product is financially sound. Artificial intelligence is complex and should be treated as such. There’s no one step process that will analyze data AND visualize it. You need both, the AI and the visualization..
Why You Need to Know
Unless you’re working directly with a robot, you might think AI isn’t a part of your life. But you interact with AI on a regular basis. If you’ve ever talked to a chat-bot, been recommended a product based on your purchase history, or told Siri to mark your calendar, you’ve dealt with artificial intelligence. Beyond the personal assistant on your smartphone, more complex AI are changing the landscape of tech and science. There are so many companies and so much money involved in AI that it’s changing everything from social media and retail to the economy and government. You help machine learning and will continue to live a world with AI. So don’t overlook the power of data visualization (and artificial intelligence).