Business Intelligence (or BI) is the strategic data analytics process that unearths crucial actionable insights. These insights are the key to making better business decisions and improving performance. And we all know just how impactful data visualization is. BI platforms create charts, graphs, dashboards, and reports.
BI tools can be an amazing investment (when used effectively). BI tools are all similar in that they serve the same purpose, so how do you choose the best solution? Between all the data sources, costs, and varying degrees of capabilities, each platform will satisfy users in slightly different ways.
When you’re considering a BI tool, make sure to assess these criteria:
- Design and Flexibility
- Ease of Use
- Ease of Integration
- Ability to Embed Visualizations
- Software/Hardware/Operational Costs
- Required Technical Expertise
- Data Permission
- Single Sign On
- Data Preparation
- Time to Deployment
- Supported Data
- Budget
Check out some commonly used platforms:
*Don’t see a platform you think should be here? Let us know and we’ll add it to the list!
*Need a BI product? We can build it, contact us!
![]()
Tableau Desktop is one of the most popular data visualization solutions out there. It’s easy to organize data and create clean designs from a collection of charts and graphs. While its visuals are simple, there’s a steep learning curve to using Tableau, especially for anyone who has never worked with any BI tool before. But thanks to its popularity, there’s no shortage of tips and tricks from other users.
Try Tableau’s 2-week free trial.
![]()
Frequently compared to Tableau, Microsoft’s Power BI is another popular tool. Its affordability is accompanied by its ease of use. Power BI is an economical tool for users who don’t need as much flexibility in scalability and embedding. And Microsoft Excel experts will feel comfortable with this Windows platform interface. This cloud-based platform is good for easy integration and quick deployment.
Download a free trial and start creating.
![]()
While it’s not the biggest name in the industry, Dundas BI‘s intuitive interface makes it very easy to design and implement visualizations. The drag-and-drop functionality allows users to work directly on the visualization AND can be shared between users. Its ease of use makes implementation fast and simple.
![]()
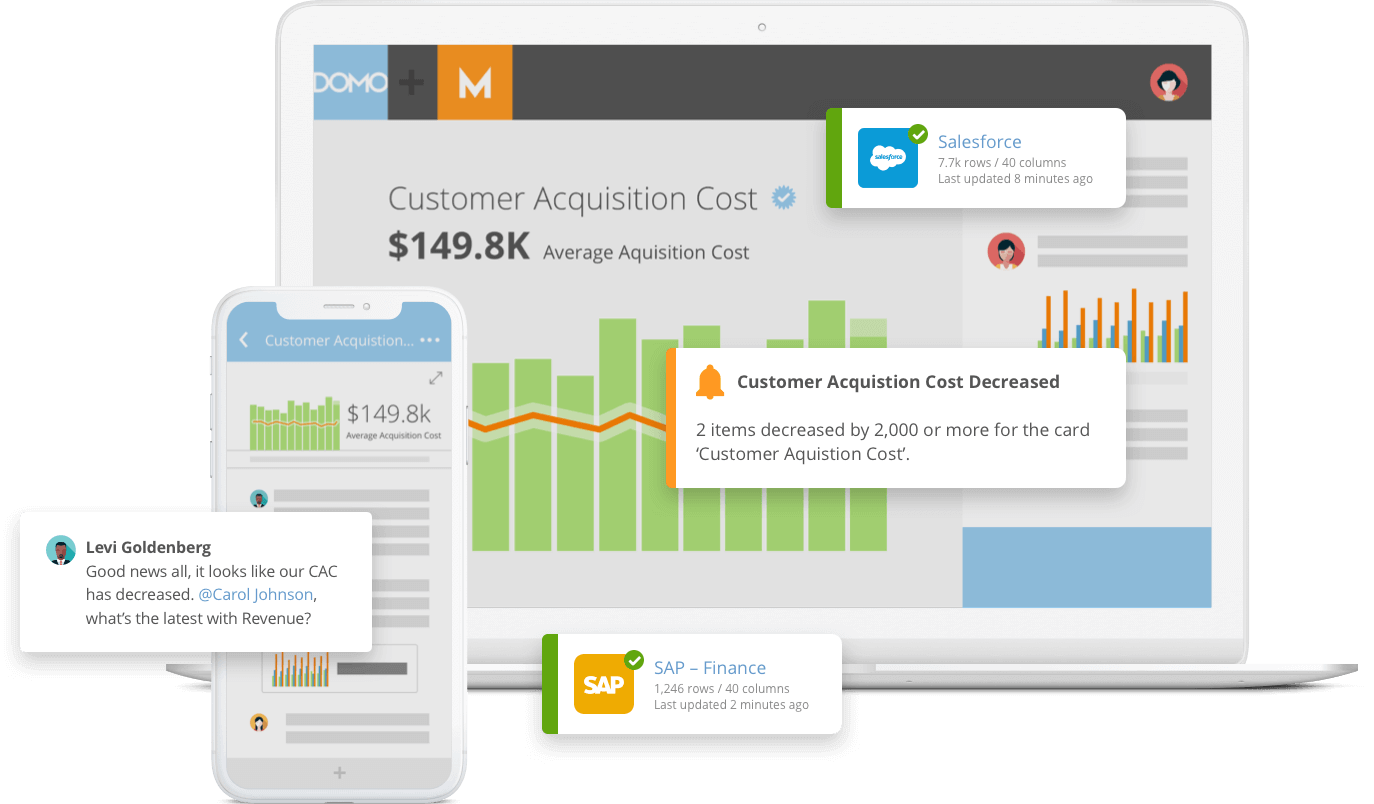
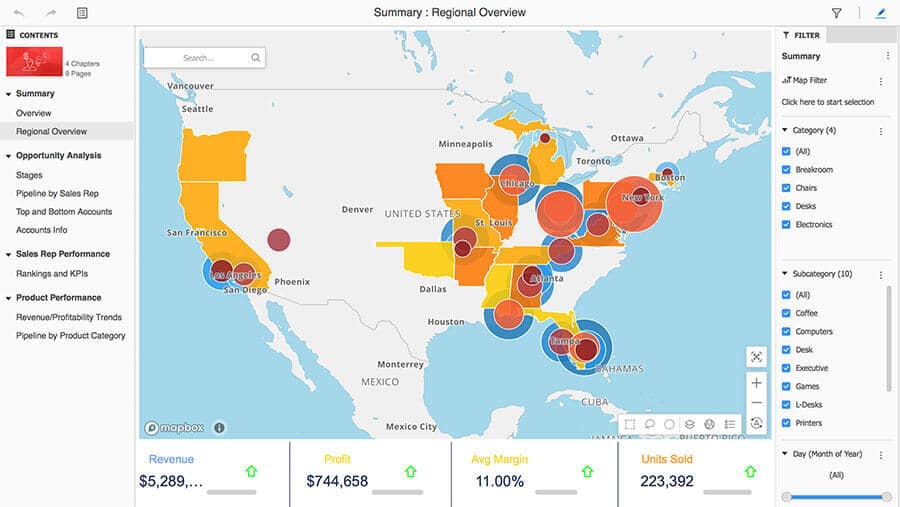
Another big name in the BI game, Domo is great for business reporting and presentation. The easy to use interface and fast implementation make designing simple. Easily integrate into the Enterprise environment while processing lots of data and concurrent users.
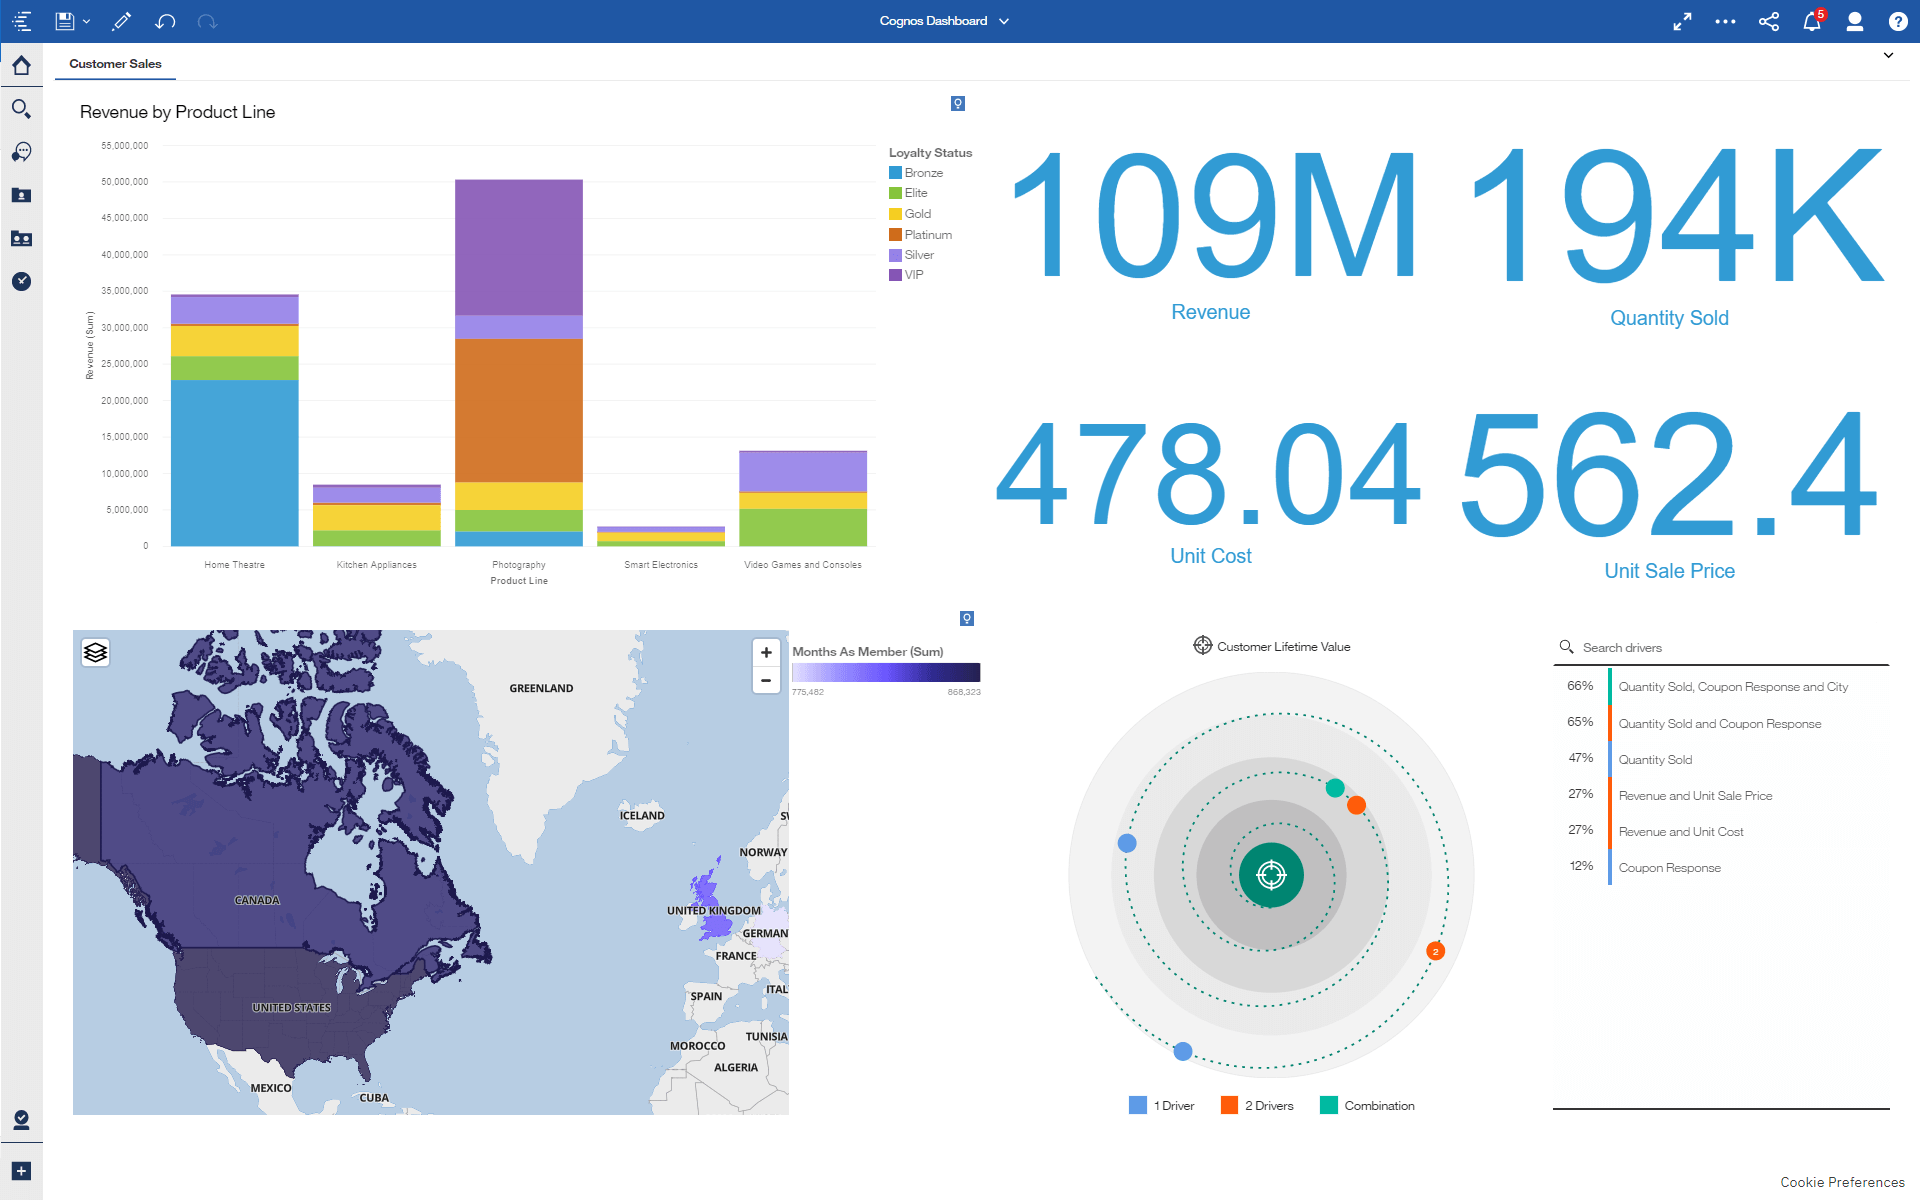
IBM Cognos Analytics
This combination AI/BI platform from IBM uses machine learning to automate data prep and help users intelligently uncover insights. Because of its AI, Cognos can handle lots of data and API analyses.
The free trial lasts for 30 days.
 Google Data Studio
With Google Data Studio, users get quick design, implementation, and the ability to easily embed visualizations. It’s simple to set up and share, but design effort is needed. It’s not the best for mobile and user-specific criteria, but it will connect with other Google platforms (Analytics, Adwords, BigQuery) so your business can make the most of what Google has to offer.
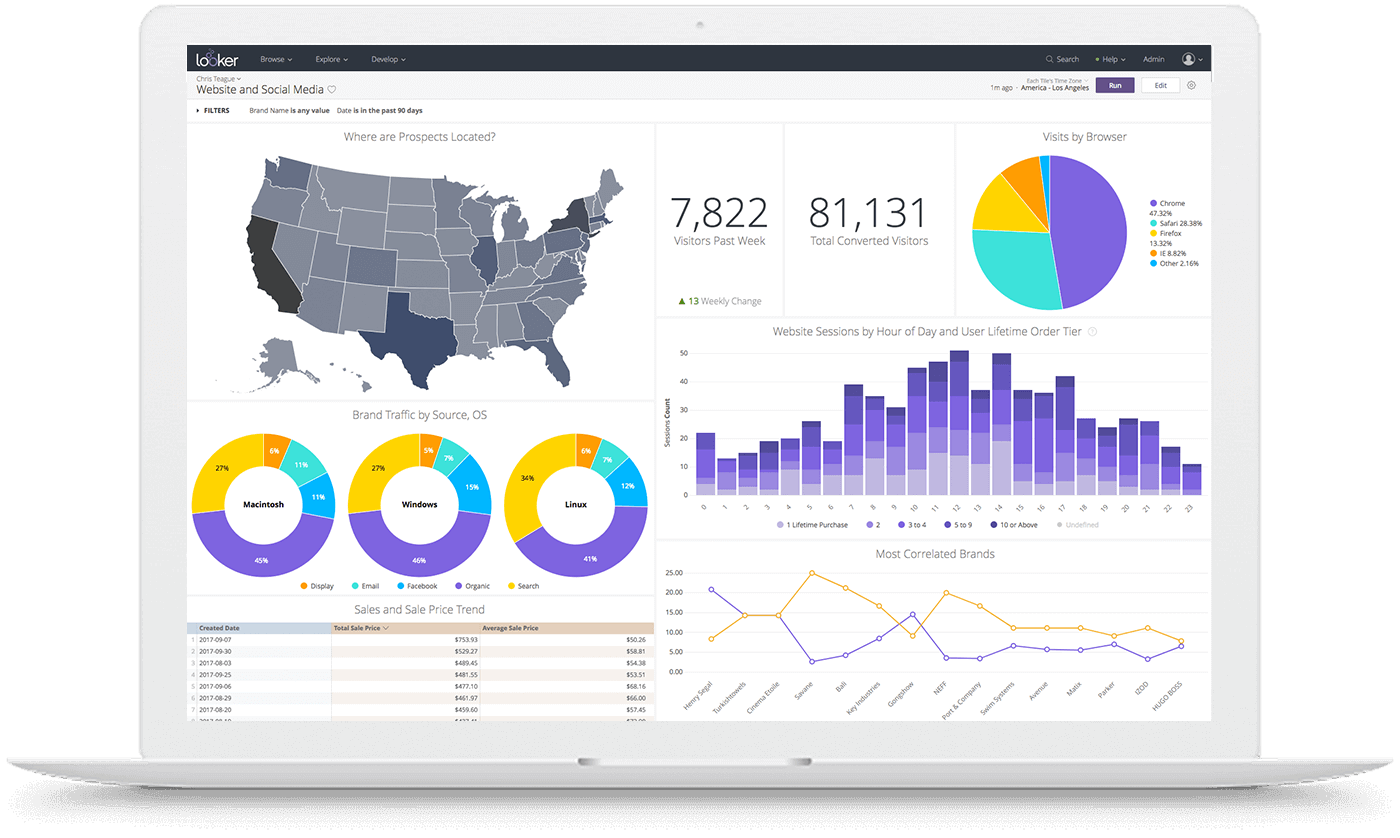
With ![]() Looker, users can design clean visualizations and customize dashboards and reports. Looker BI can clean, structure, and join data sources for easier analysis. Connect with any relational database and automatically generate a data model, then start creating
Looker, users can design clean visualizations and customize dashboards and reports. Looker BI can clean, structure, and join data sources for easier analysis. Connect with any relational database and automatically generate a data model, then start creating
Request a free trial for your business.
![]()
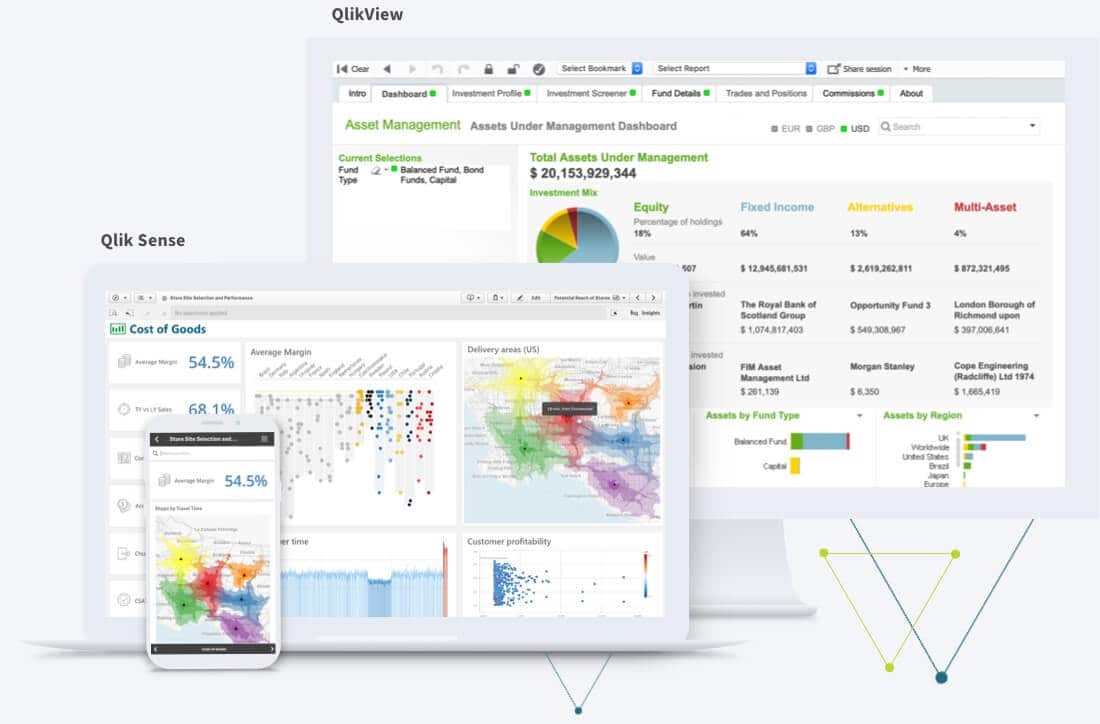
Qlik’s business intelligence solutions can handle analytics on an enterprise scale and create attractive visualizations. Organizations use QuikView for its flexibility and ability to consolidate data.
Download a free trial to the desktop software or cloud account.
![]() Sisense (recently merged with Periscope Data, another BI platform). This end-to-end solution works with your database and ETL to deliver analytics and visualizations. Sisense is even equipped with AI technology to support better analytics, both offline and on the cloud. And since its merger, it can be used with Periscope for even deeper analytics and more visualizations.
Sisense (recently merged with Periscope Data, another BI platform). This end-to-end solution works with your database and ETL to deliver analytics and visualizations. Sisense is even equipped with AI technology to support better analytics, both offline and on the cloud. And since its merger, it can be used with Periscope for even deeper analytics and more visualizations.
Get a 90 minute test-drive with a Sisense expert.
![]() With Microstrategy, it’s easy to integrate with your enterprise environment. In this cloud platform, the drag and drop interface makes it easier to explore data designs. Microstrategy even offers tools and templates to save even more time. Connect to any number of databases to visualize the data you need in one platform.
With Microstrategy, it’s easy to integrate with your enterprise environment. In this cloud platform, the drag and drop interface makes it easier to explore data designs. Microstrategy even offers tools and templates to save even more time. Connect to any number of databases to visualize the data you need in one platform.
Custom
If you don’t like what any tool has to offer, you can choose to build a custom open source solution. You’ll be able to design, implement, and integrate whatever you want to create. Although you can completely customize every aspect of your visualizations, it requires in-depth expertise, time, and money.