
A Net Promoter Score is a metric used to measure customer experience and loyalty. Key performance indicators (KPIs) are quantified units that measure and track business goals. Ideally, you want your net promoter score and KPIs in good range to prove your business is doing well. Otherwise, they’re just another reminder how bad business is. In any case, having metrics at all can significantly boost business performance.
Can I manually calculate my metrics?
With a small enough data stream, you can. But larger businesses dealing with multiple revenue sources, products, locations, stores, etc. cannot accurately process an inhuman volume of analytics.
So what’s the solution? Better software.
Better software alone can deliver streamlined analytics ready for reporting, or goal planning in no time at all. At Boost Labs, we know just how much analytics and data visualization is needed to make the most of data. So believe us when we say data analytics doesn’t stop after a few calculations. The software translates raw data into understandable metrics that become tools for higher level analysis.
It seems obvious to analyze data metrics, but many businesses falter when it comes to approaching new tactics and trend. Meaning they’re missing out on potentially profitable insights. Smart data analytics can easily improve business performance, but you probably need some help.
Data and software
To calculate any metric, you need data. Some data sets are more straightforward than others, requiring less evaluation. But more often than not, you’ll need to ask many questions:
- Where does the data come from and how will it be collected?
- How much does the data cover? Do you need more or less?
- Are there strange outliers? What outside context is needed?
- What formulas are used to calculate the metrics?
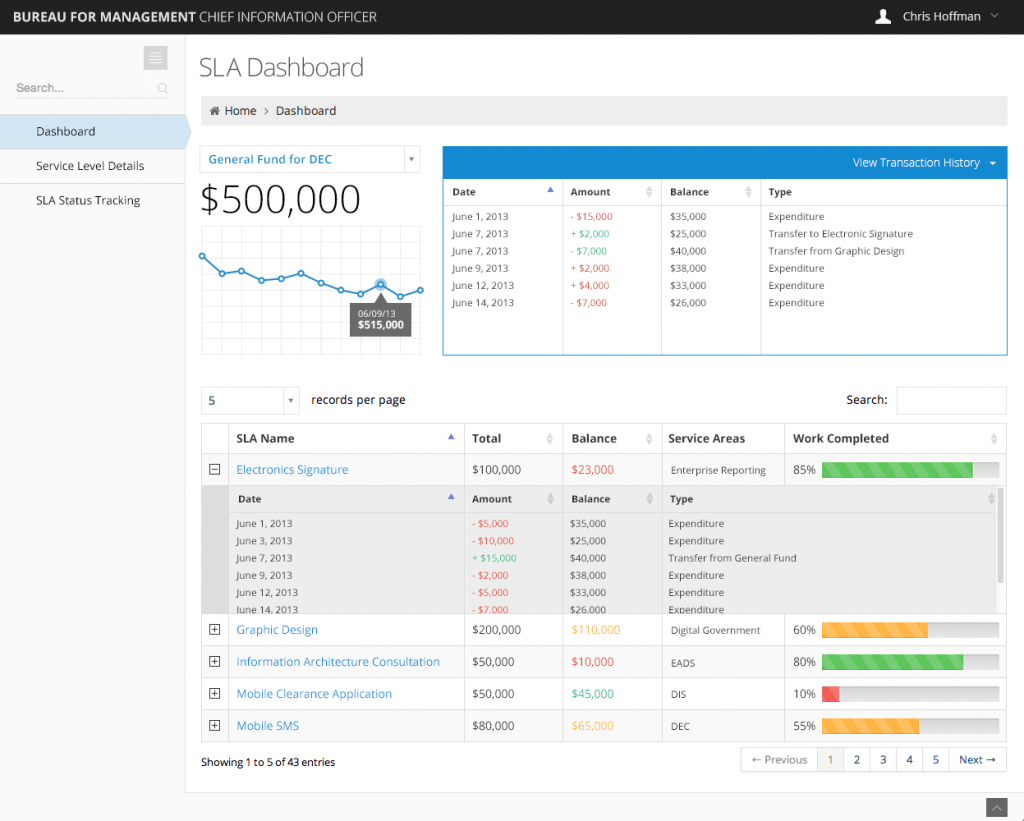
It’s a lot to ask and brings up many complexities along the way. But even a simple MVP (Minimum viable product) Dashboard will calculate, consolidate, and visualize comprehensive metrics.
But even software isn’t always perfect. In an ever-changing business landscape with new technology, apps, and trends, software must also adapt.
How to read the data
No matter how much you apply yourself to handling raw data, it’s not the best use of your time. Particularly for large businesses, the sheer volume of data requires a more developed approach. You need data stories. Unlike precise formulas, data stories don’t stop with numbers. Deeper comprehension is built on context.
- Why do the metrics look the way they do?
- What problems exist and how will they be solved?
- How can the metrics be used in marketing, investing, advertising, etc?
In turn, insights are intelligently applied to lead operations in any or all departments.
Finding value and success
While these metrics aren’t requirements, consistently successful businesses know data analytics lead to smarter operations. Not only do these tools translate large data sets into easy-to-read visuals, they lay the foundation to successful analytics. There’s a good reason why companies use a simple customer survey to calculate their Net Promoter Score. Insights are priceless because they offer impetus for improvement.
Go beyond the obvious and make the most of data with metrics.