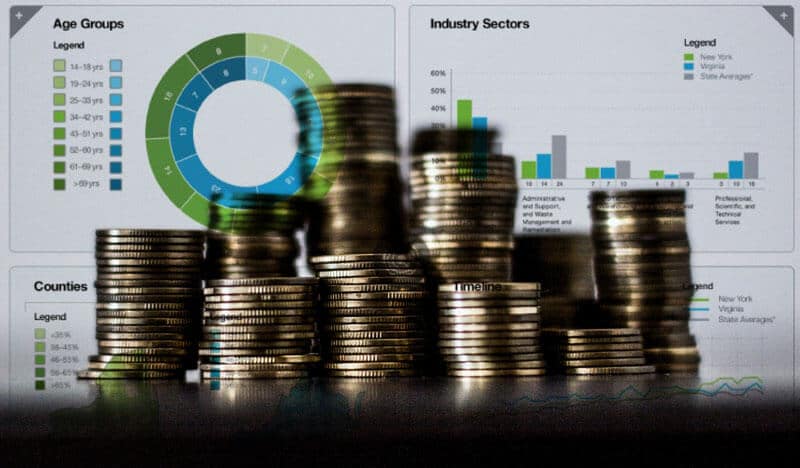
When you mention the word “currency”, the first thing that comes to mind for most people is a dollar, euro or something similar. Currency, in reality, is anything that is used as an agreed value. A Starbucks gift card could be considered currency. Collecting reward points from a credit card could be considered currency.
Over the last few years with the rise of Big Data, the traditional definition of currency is changing. To many organizations, Data, is viewed as tangible currency based on its profitability potential.
Capgemini shares the value organization’s are putting on data in their report “Big & Fast Data: The Rise of Insight-Driven Business”:
- 64% Agree that Big Data is changing traditional business boundaries
- 53% Agree that they are facing increasing competition from data enabled start-ups
- 43% Are restructuring their organization to exploit data opportunities
Recognizing that data is valuable is just the first step, but everywhere you look, data is being collected. Your cellphone usage and behavior is someone’s data. Your newer cars are pushing data to a central source. The websites you visit and interact with are collecting data. All of this data is very overwhelming, but still important, so is the challenge of assigning value to data and presenting it in real-time and with accuracy.
So how do you make your data more valuable?
Understanding which data has monetary value is one thing. Using valuable time and resources to compile the data is another thing and the amount of time it takes to compile leaves room for inaccuracy and diminishes the value. To help with this, there are many business intelligence and data aggregation tools available. Many of those tools help with visualizing insights or clues as to the inherit value of the data. The next step would be to determine how to go beyond visual insights and create a product that can help monetize it.
There are many products that can help monetize the data. Examples are:
- Information Dashboards: Many organizations consider this as a “corporate dashboard” or “corporate scorecard”. The ROI on an Information Dashboard comes when an organization requires an easier view into the performance of the company and help unify focus towards specific goals.
- Automated Report: Many IR (investor relations) departments look at automation of unique reports like a pitchbook or quartly report as a means to reduce overall costs, but to also improve investor relationships. Having fast unique reports that can reduce several months of work into just seconds is an extremely powerful ROI.
- Infographics or Interactive Data Visualization App: The clearest ROI is client retention in a world where anything online can capture target customers for just a matter of seconds. Having a unique way to represent data in order to increase online interactions from seconds to several minutes is a major accomplishment. Increased attention and engagement from target customers can translate to multiple forms of ROI.
Data is the next currency. If you do not have a unique data product presenting your data, it is time. Use the value of data and increase your organization’s profit, otherwise, you may be losing money and opportunity because your most valuable data is not in front of you.
