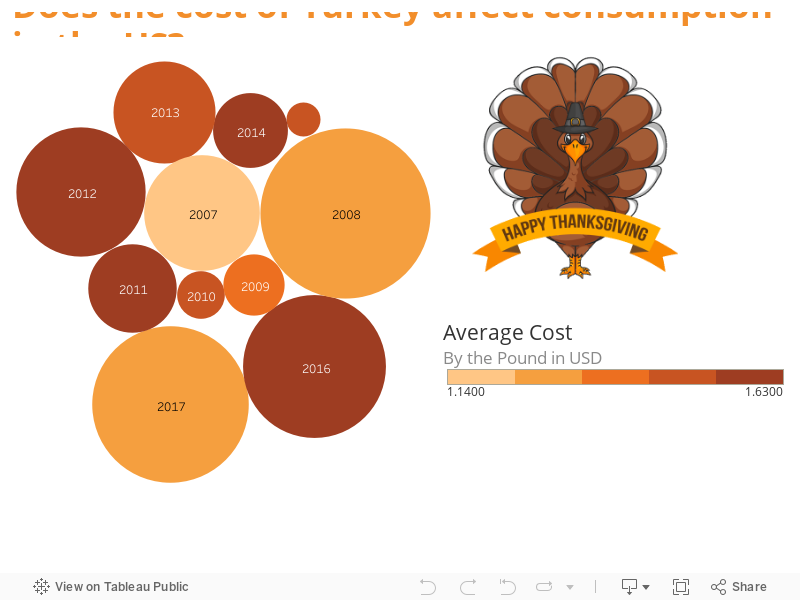
Thanksgiving 2017 is around the corner and we thought what better way to celebrate than to make a quick visualization in Tableau. The data was sourced from Bureau of Labor Statistics (BLS) and USDA. What we wanted to know: Do we eat less turkey if the cost per pound rises?
Find out below!
The data visualization was created using Tableau 10.4.
Happy Thanksgiving!!!