
Data visualizations and data products have very obvious value in the workplace and data related tech. But have you ever thought about how visualization can protect you? Because it’s actually very crucial to epidemiology and your health.
Public Health
We usually think of health care as going to the doctor, but data visualization also plays a huge role. In the 1800’s, cholera plagued many countries, resulting in many deaths. Medical professionals were stumped as to how the disease was spreading but found it difficult to track. Data visualization enabled doctors to analyze and discover how the cholera epidemic was spreading. A map of the area was combined with data out the locations of cholera outbreaks.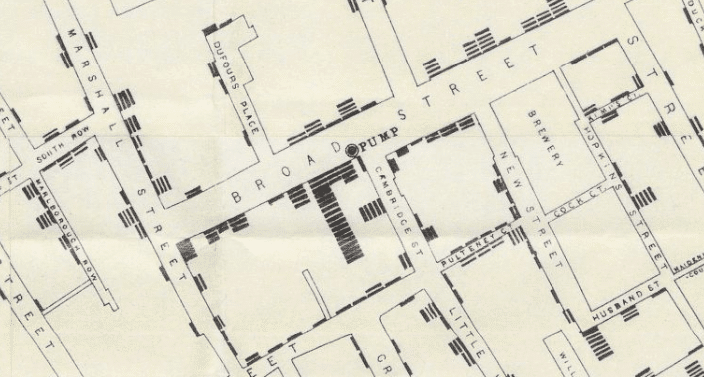
Once someone saw that outbreaks were clustered around water sources, the public could be informed. Not only were they able to convey the gravity of the death toll, but they accurately identified how cholera spread: via water. It was the game changer they needed and we still use it today.
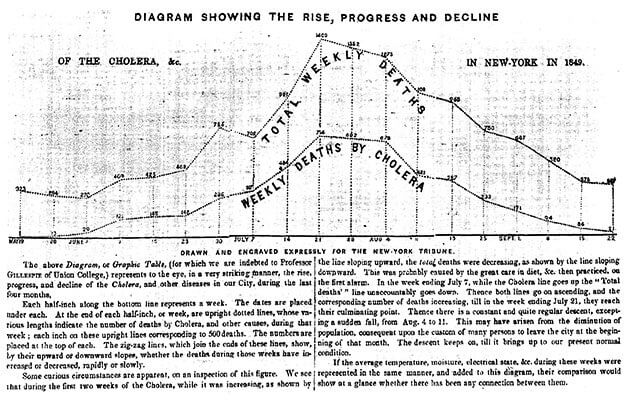
Educating the public encourages prevention. If everyone is able to understand the circumstances and take precautions, then the effects of disease are greatly reduced. Today, health institutes like the CDC and WHO look for any trace of a dangerous disease and possible solutions to relay. The spread of disease is better explained to the public with data visualization because it captures a lot of information in a single visual. How many people are affected? How fast is it spreading? Has anyone died?
Approaching a national or even a global audience is a difficult feat because convincing people to change their behavior is difficult, even when others are dying. And this should be a serious personal concern because if the public fails to heed the warnings, you are more likely to run into whatever’s going around.
Personal Health
On a smaller scale, you need to protect your own health and adopt safe practices. You can only hope other people are doing the same (but you really can’t). You can’t expect everyone to know what you do and behave the same way. And that means you can be at risk anywhere. Personal health ties in heavily with public health. Regardless of what you do, you are more vulnerable to an epidemic if it surrounds you.
- A recent outbreak of e.coli has killed one person and continues to threaten others through romaine lettuce. The CDC has advised people to stay away from romaine lettuce as a preventative measure but cases continue to appear
- Norovirus is the biggest cause of foodborne illness in the U.S. and we continue to see outbreaks due to a variety of reasons, including poor hand washing. It’s highly contagious and was recently found in oysters from Canada
- There’s been a death from the plague in Bolivia, prompting local efforts to educate civilians about insecticides and hand-washing, because ticks and fleas easily make their way into home via pets to spread disease
Health epidemics aren’t confined to your body either. Stores and restaurants suffer huge losses and are even shut down following headlines, disrupting profits and jobs. These illnesses can overwhelm hospitals with hysteria, bringing medical attention to a standstill. With such large data volumes of patients for a range of medical staff, accessing patient information can be a hindrance. A more effective interface can reduce time wasted on tedious searches so medical employees can get the information they need more quickly. But with a flood panicking patients, those searches are even slower.
But good news, data visualization has proven results. In Missouri, a county was able to reduce the number of influenza cases because the local health department used data visualization to educate the public. So it does work, we just need to pay attention.
The Future
Not to make you paranoid, but scientists have found a correlation between population size and pandemics. Throughout history, fatal pandemics regularly ravaged the world when the human population grew significantly. With a world population of 11 billion, we’re overdue for a deadly wipeout. Maybe it’ll be a drug resistant super-virus or a new mutation that we know nothing about.
More than ever, we are educated and have a better understanding on how we can prevent, treat, and predict the spread of diseases. Public and personal education is beneficial to everybody. Let data visualization help.