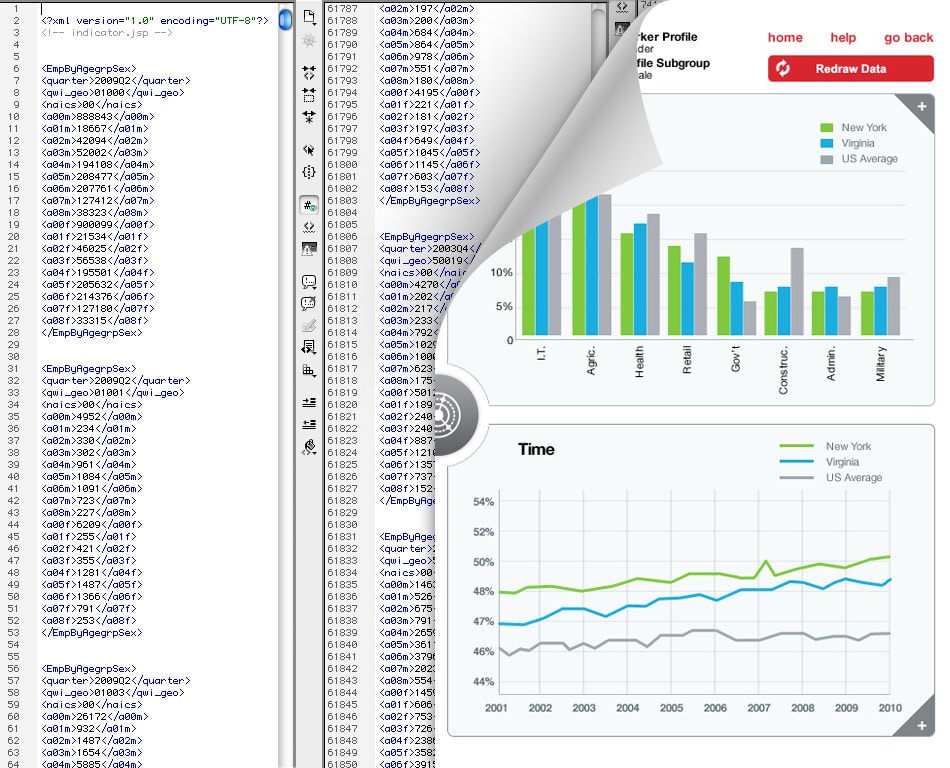
In most businesses, data is a highly underutilized tool. Existing in spreadsheets, databases, and otherwise difficult-to-access forms, it’s rarely analyzed efficiently or thoroughly. This means valuable insights may go completely overlooked, potentially costing an organization money and wasting resources.
Many organizations attempt to make their data more useful by hiring an in-house data analyst (or by assigning analysis responsibilities to an existing worker). While this works for some businesses, it’s not right for all – especially those unable to justify the cost of having a full-time analyst on their staff.
What if there is an easier way to pull insights from data without the hassle of training a new employee or forcing management to endure hours of statistics classes?
Enter information dashboards.
What is an Information Dashboard?
As we’ve discussed before, an information dashboard is a simple and clear way to visualize important business data. By utilizing a data visualization dashboard, upper- and mid-level management can personally see their organization’s key performance indicators and make decisions based on that information.
Essentially, an information dashboard tells the story of an organization’s data. It answers the questions, “How are we doing right now, and how does that compare to how we could be doing?”
One reason an information dashboard is so useful is that the data is presented in a visual way. At Boost Labs, we analyze the unique business use cases of our clients to determine the most effective way to visually communicate their important data.
Our specialty is developing new data visualization dashboard concepts. This was the case in the visualization we created for U.S. Census Bureau.
Saving Time and Money with a Digital Dashboard
Creating and using custom information dashboards benefits organizations in several ways:
- Dashboards help prioritize and make sense of the almost overwhelming amount of data available to most companies.
- Employees can save time (and company money) by using easy-to-interpret dashboards instead of analyzing emails, papers, documents, and databases themselves.
- Upper management can access real-time data without needing to have information translated through a data analyst.
- Dashboard information is “read only,” meaning there’s no chance of accidentally changing or erasing database information when trying to view it.
- Public information dashboards about a company can be used to promote positive awareness (such as a live count of people helped through an organization’s services).
- Because they deliver real-time data, dashboards provide a reliable source of information (rather than outdated data) for decision making.
- The entire company can monitor performance of the company, which means everyone can celebrate the wins or rally to save the day
Why a Custom Dashboard is Absolutely Necessary
Without delivering the time- and cost-saving benefits described above, a dashboard won’t have a significant return on investment. To make sure a digital dashboard is a smart investment, it needs to have metrics that are tailored to the target audience – a specific organization’s employees.
Customization doesn’t need to stop at the organizational level. Depending on the type of customization, it’s even possible for employees in the same organization to see a different data visualization dashboard depending on their roles and data needs.
For example, a manager may see one set of data visualized on a dashboard (such as sales for his or her team), while a vice president would need to have a summary of different information (such as the company’s monthly revenue).
No matter where an employee is in an organization, a custom-built data dashboard can improve the quality of decision making, save time, and bring a positive return-on-investment. However, it’s important that the data dashboards used are customized to meet the needs of the organization it serves.
