Select Work

TrueCar: Executive Dashboard

poster infographic about the US ARMY depicting data visualization flow charts for monetary commitments, budget allocation, and personnel

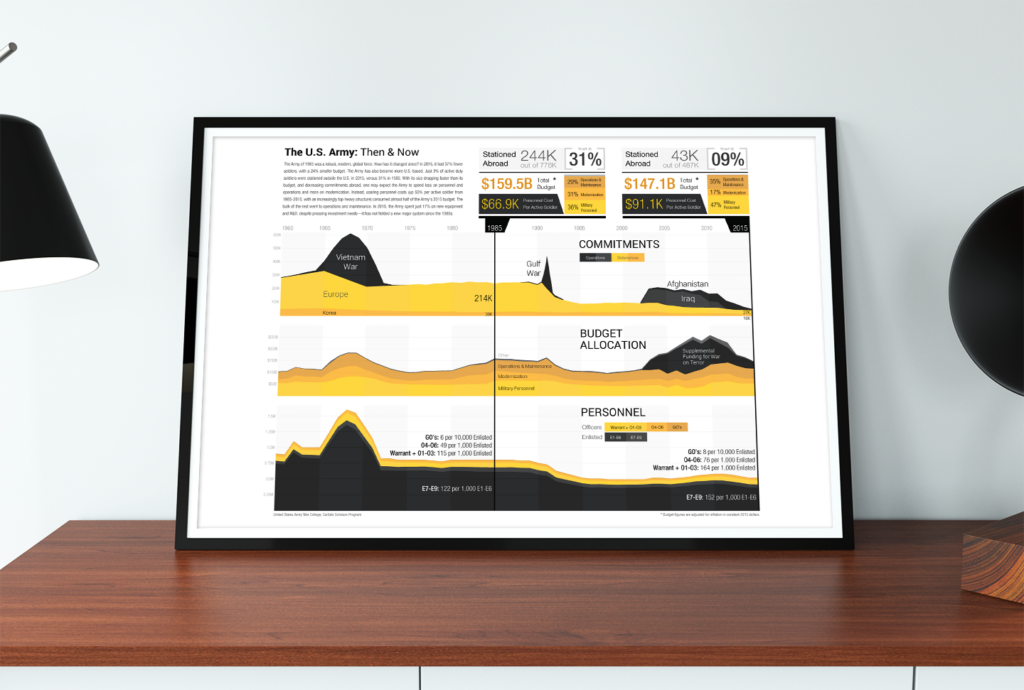
US ARMY Then and Now

a computer monitor with the Athena Health application depicting a standard deviation model of same-store growth of primary care physician practices

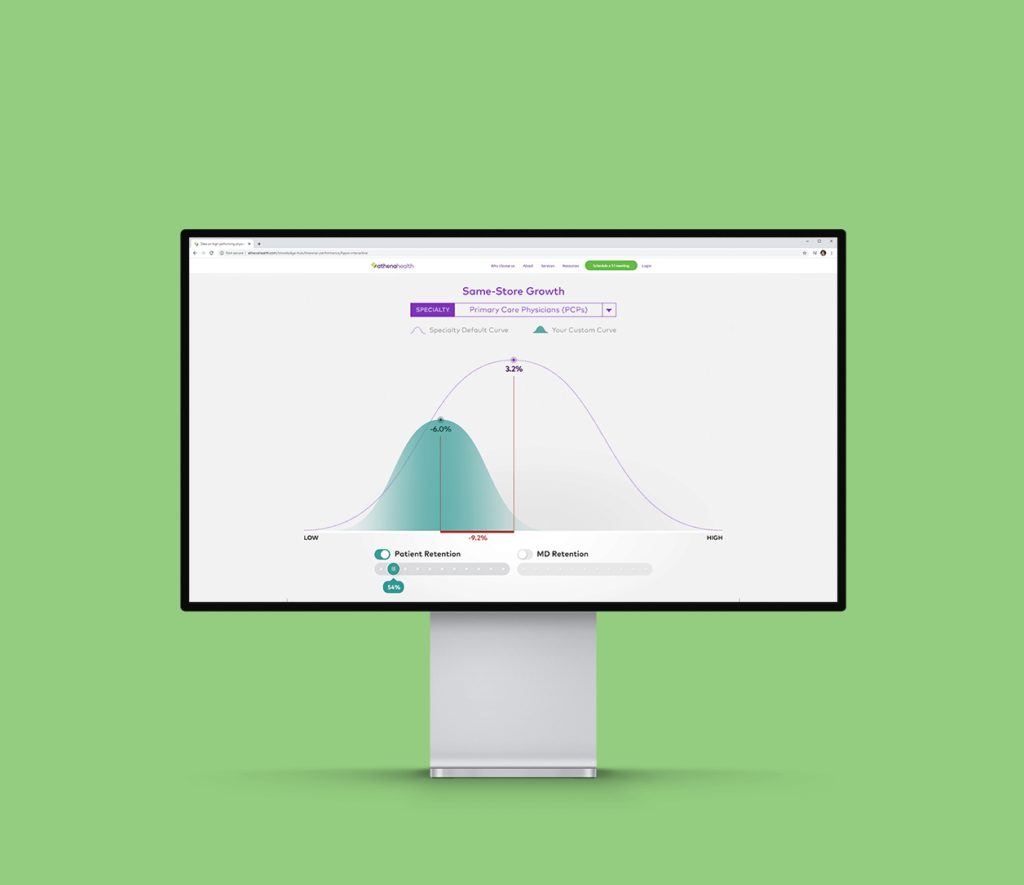
Athena Health: The High-Performing Physician Network App

annual report pamphlet brochure print design showing data visualizations for investors

Investor Relations Portal & Annual Reports

MacBook with USAID's SLA application depicting financial investments in various sectors and countries

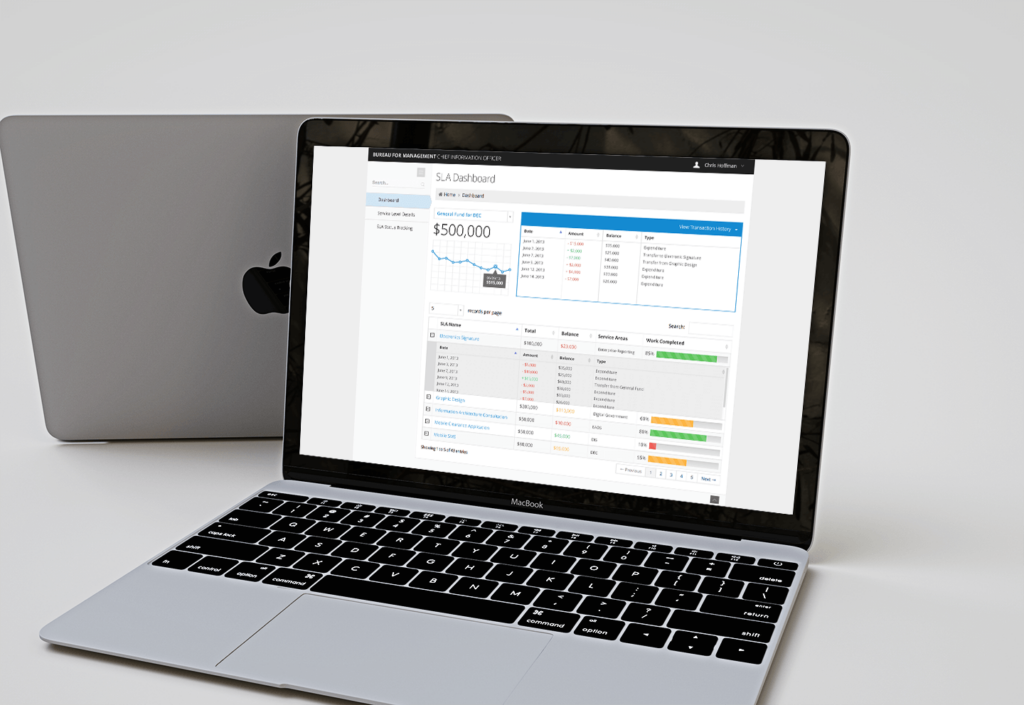
USAID: SLA Dashboard

a poster on a wall depicting the growth of the AAPI population in America, geographic concentration centers, and diversity within the community

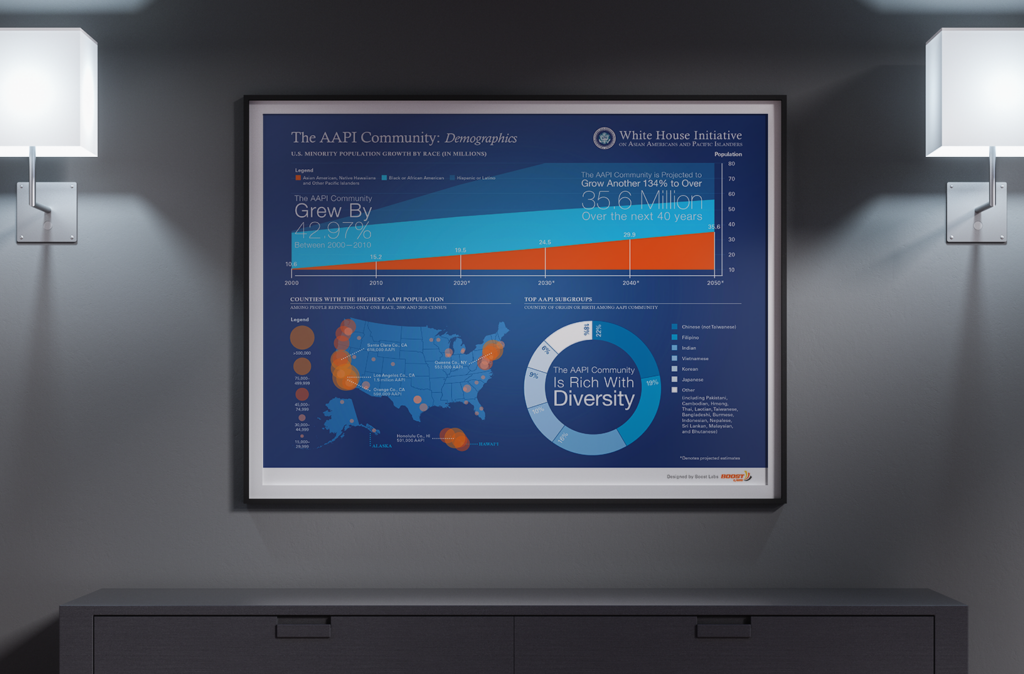
White House Initiative on APPI: Infographics

iPad with a woman navigating the Athena Health Medical Practice App. The screen reads, "Technology and Physician Discontent"

Athena Health: The Evolution of Medical Practice Application

iMac display with TrueCar OEM Dashboard digital product user experience

TrueCar: OEM Dashboard for Automotive Consumers

GURU network diagram in a dashboard on a television screen hanging on a wall

GURU: Network Diagram Dashboard

tablet computer with a healthcare reimbursements application showing clients, medicare payout information, longitudinal trends, etc.

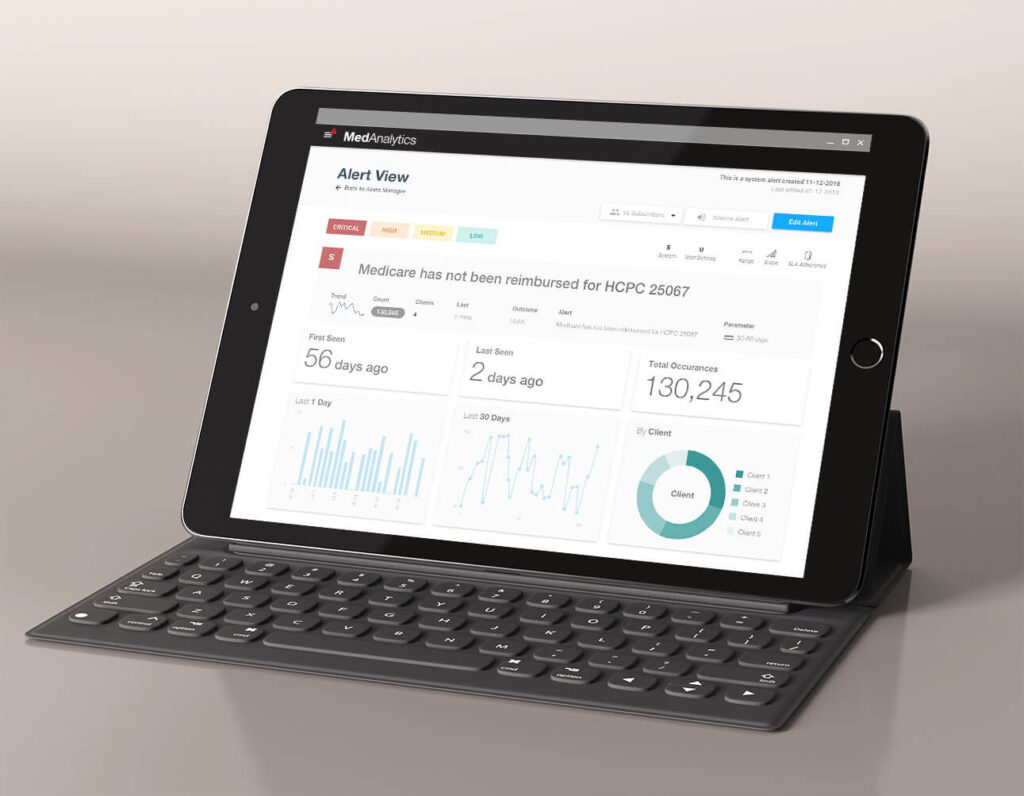
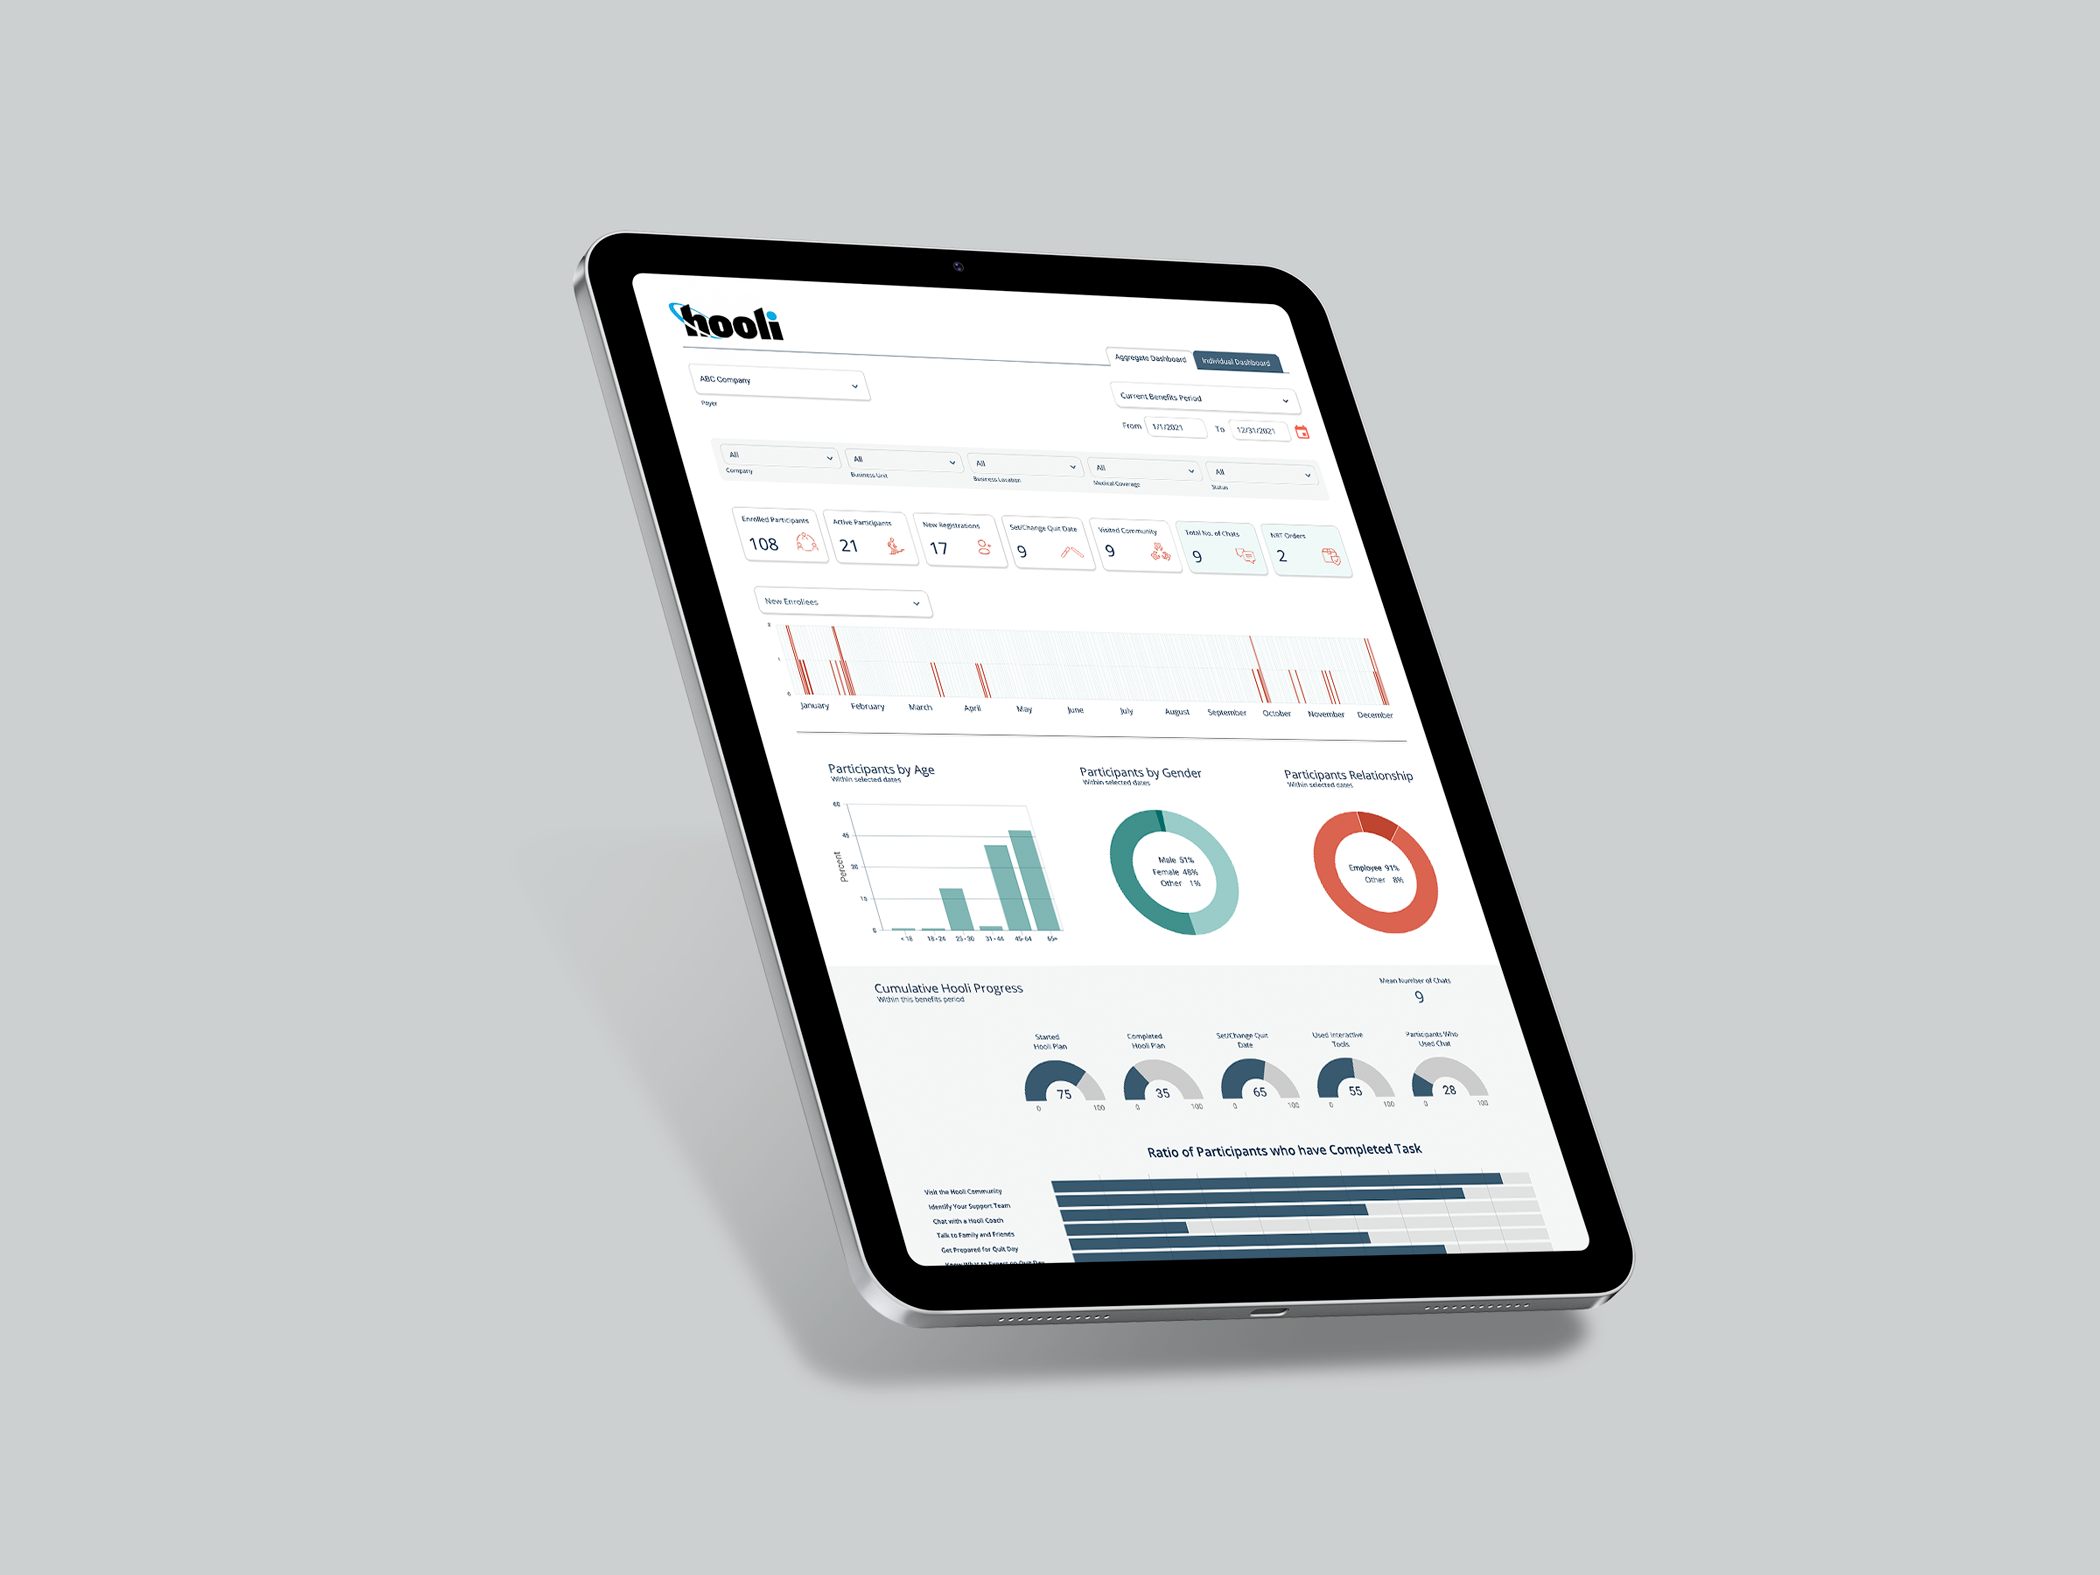
Med Analytics: MVP Dashboard

Dashboard depicting 3D ship data visualization for Celebrity Cruises

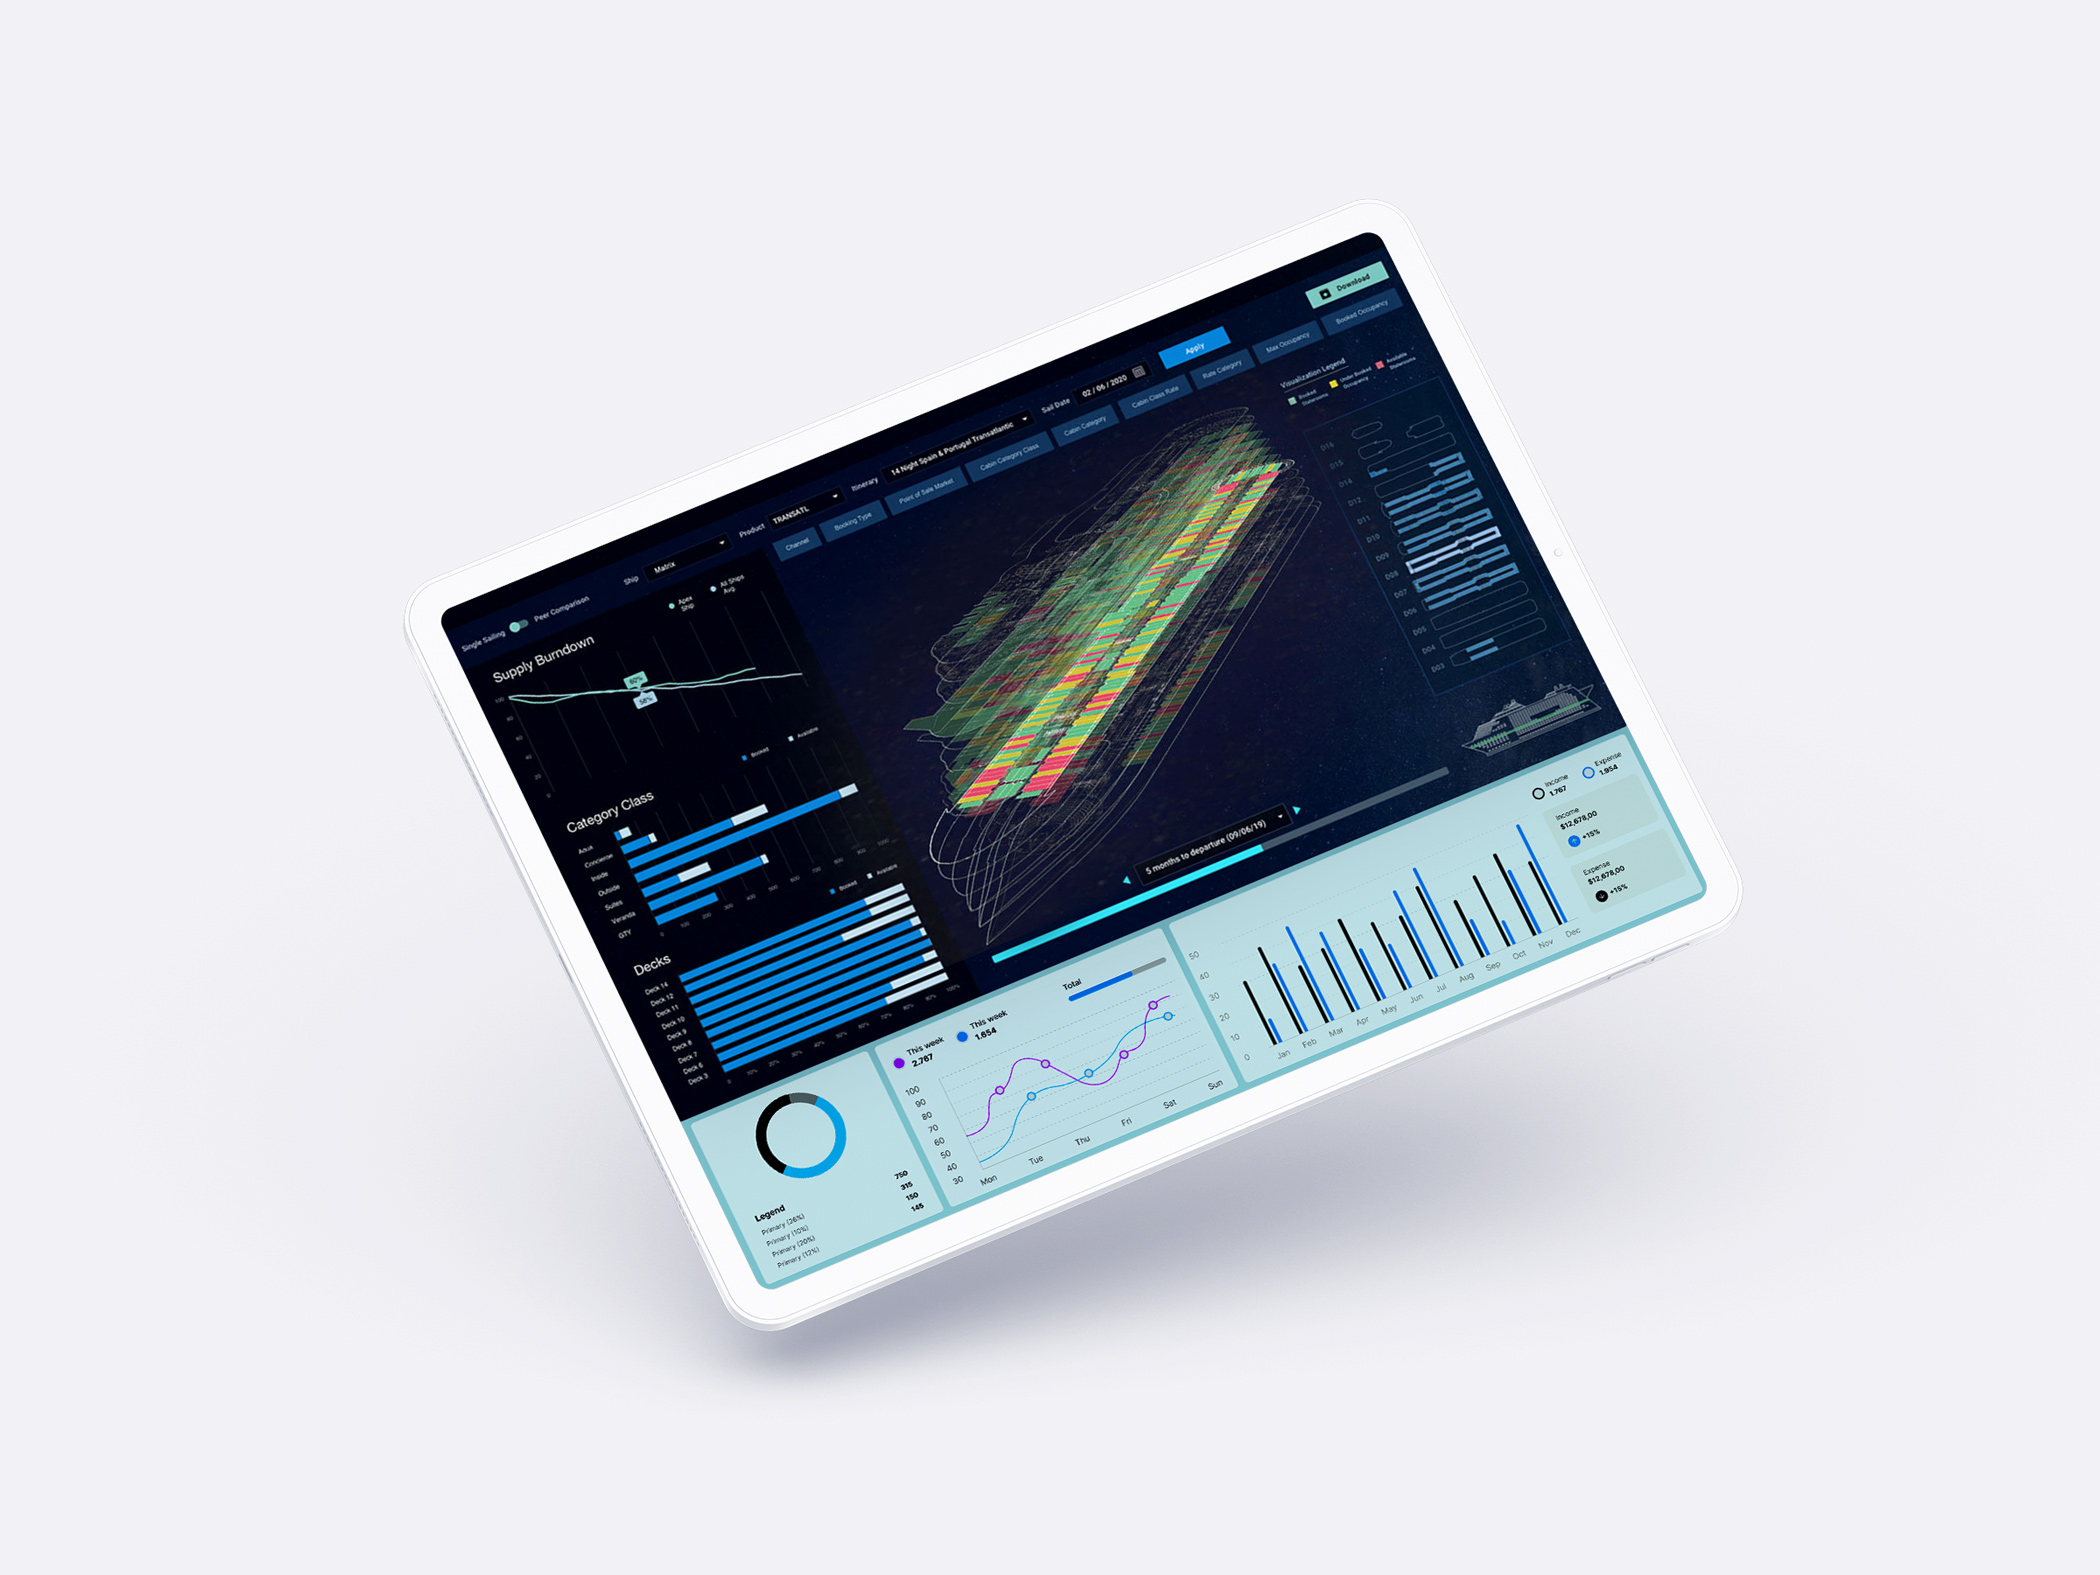
Celebrity Cruises: 3D Ship Visualization Prototype Dashboard

TopGear data visualization on MacBook Pro

TopGear: Interactive Data Visualization Web Application

iMac with screen showing Census Bureau's LEHD application. The user has selected two states to compare

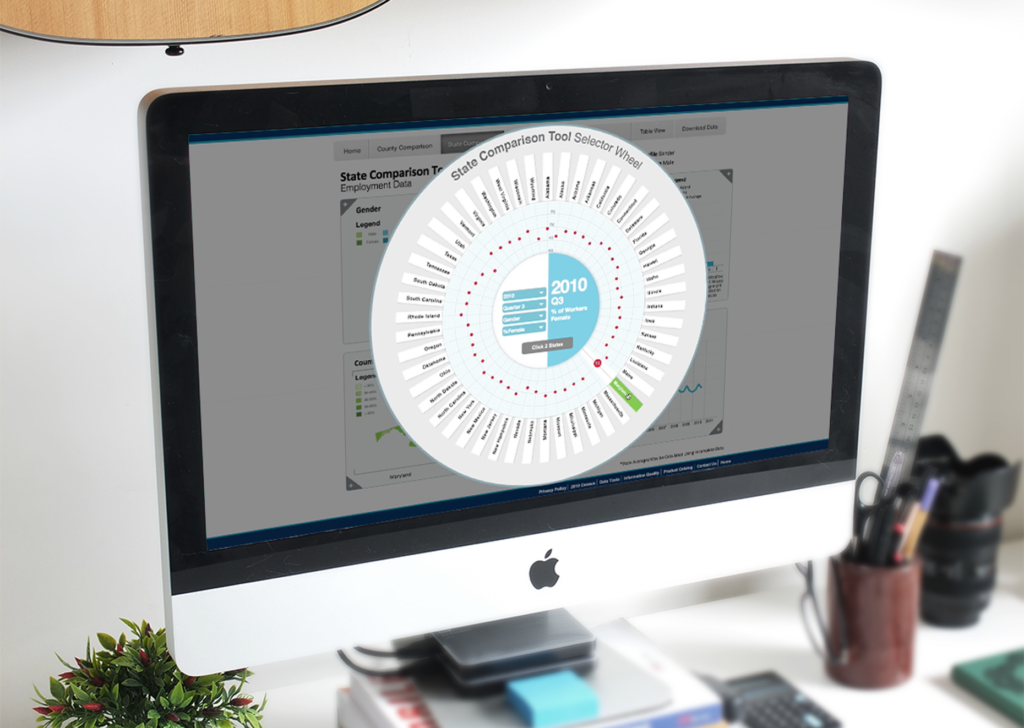
US Census Bureau: LEHD Dashboard Application

computer monitor with Resonate's Audience Builder marketing data navigation application

Resonate: Hierarchical Marketing Data Navigation

iPad with EmergencyCommand application showing alerts, individuals on each floor of a federal office building, and response times

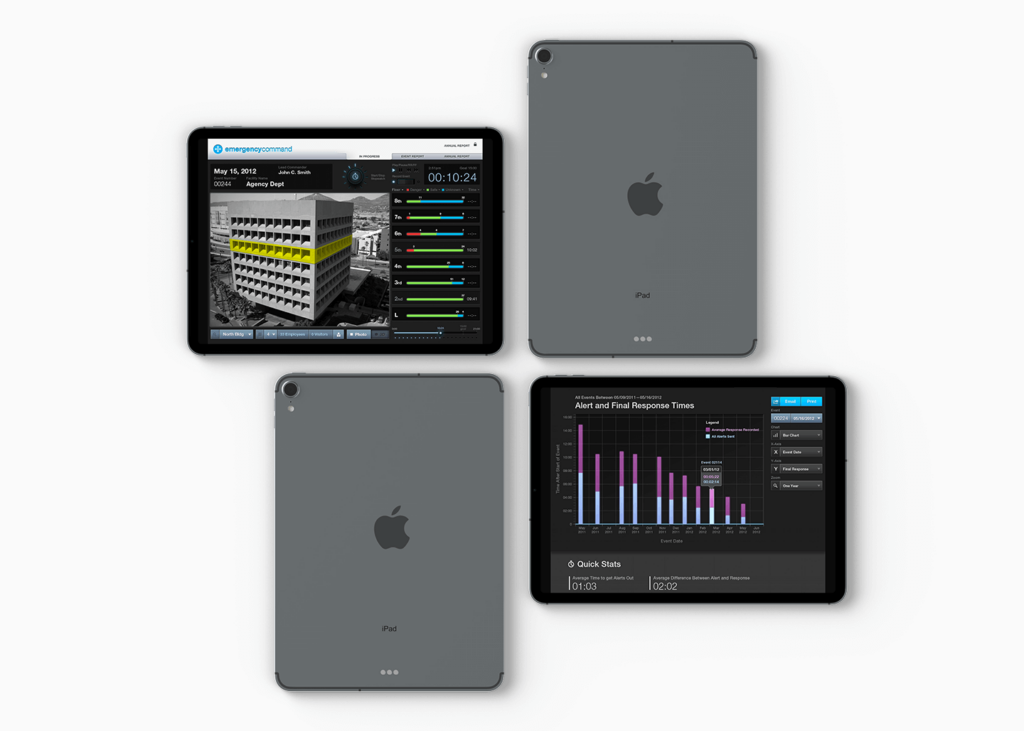
Emergency Management Mobile Application

Residential Real Estate dashboard depicting trends and market analysis

Radian: Home Price Index (HPI) for Mortgage Lenders and Servicers

Printed spreads of annual reports depicting financial data visualizations with maps and charts

Bank of New York Mellon (BNY Mellon): Annual Reports

iPhone with data visualization map of Pakistan depicting key social indicators

NBR: Mapping Pakistan’s Dynamics

Infographic poster hanging on a wall above a couch showing the Nürburgring Nordschleife top production car lap times

Nürburgring Nordschleife Infographic

GURU dashboard depicting 3D network diagram model

GURU: 3D Building Network Viewer