Redefining Consumer Demand Patterns with 3-D Visualizations
Project Brief
An international Cruise Travel Company faced an ongoing challenge: How to know which sailings need additional bookings, and why aren’t they fully booked? Are booking on track with what we should expect? Are our prices set to meet the demand of staterooms of various classes?
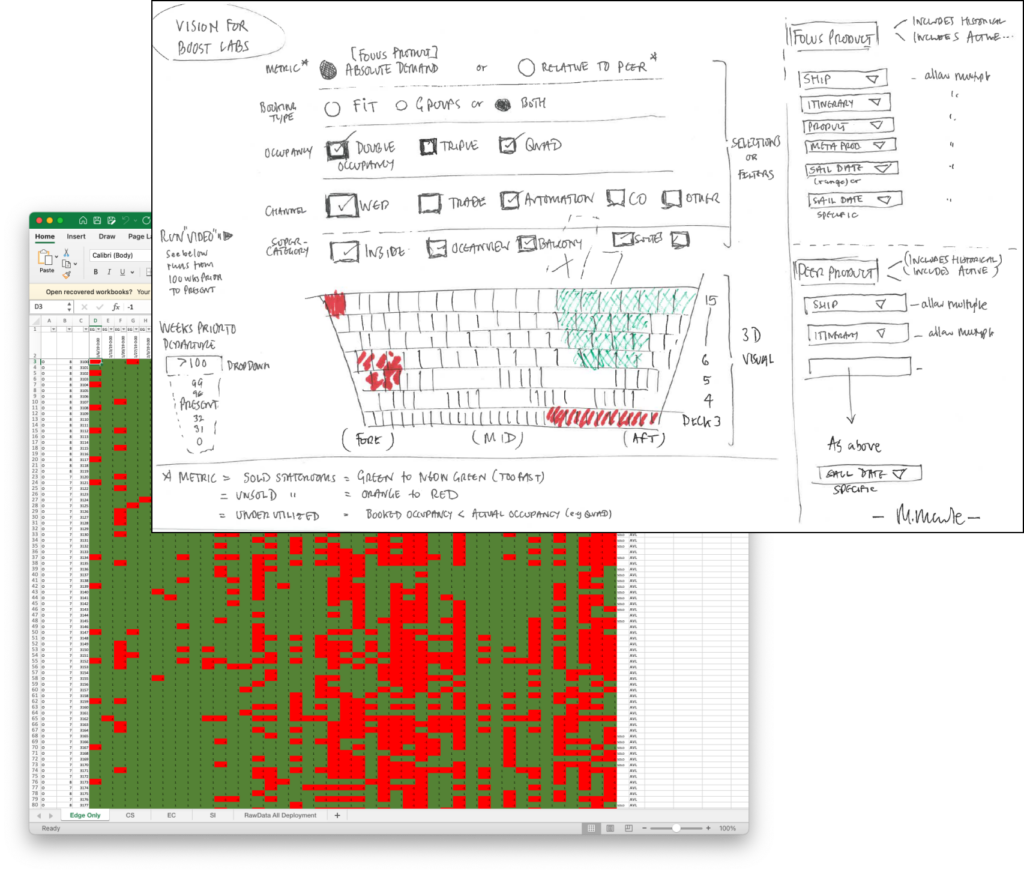
These seemingly simple data stories are only answerable by visualizing bookings in multiple ways to make sense of it. A “prototype” Excel document and sketch were provided to Boost Labs to kick off our initial discussions.
“Thank You to the team at Boost Labs for using their supreme Data Visualization techniques to turn my terribly amateur artwork and idea into a fully functioning interactive 3D visualization of Ship / Deck / Stateroom consumer demand patterns”
— client testimonial
Capabilities Delivered
- Business Intelligence
- User Research
- UI/UX Design
- Rapid Prototyping
- Data Visualization
- Use of 3-D
- Custom Development
01.
Business Intelligence
We were very fortunate to have a subject-matter expert in the cruise industry who understood the challenges facing bookings data transparency and analysis. This subject-matter-expert (SME) was a key stakeholder on the project and lead the way when it came to translating user desired outcomes with feasible and real solutions.
02.
User Research
Our team interviewed users to understand their needs and pain points. This is how we wrote the crucial questions to answer for users. These questions exposed many data and design problems for the team to solve, to name a few:
- What is the most intuitive method for selecting a cruise ship’s specific sailing?
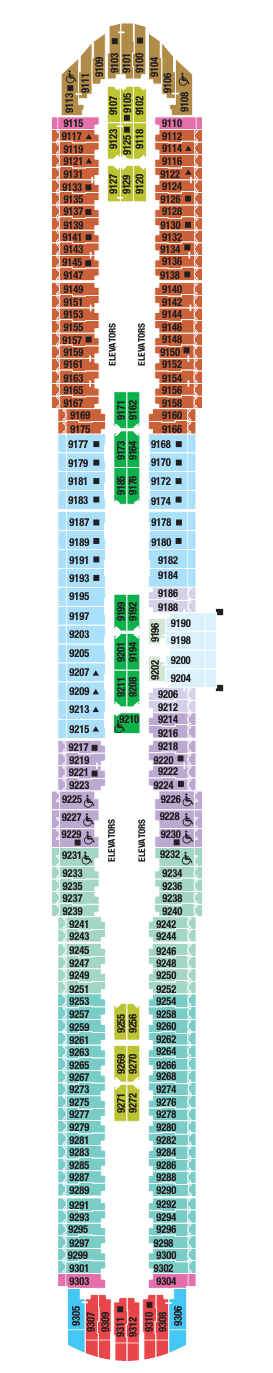
- How to visualize a ship’s bookings when many staterooms are different shapes, sizes, class, and ships have as many as 16 levels?
- How can we best illuminate whether a ship’s bookings are on track to sell out prior to sailing, or behind schedule?
03.
Data Analysis
The Boost Labs team worked with our subject-matter-expert to analyze cruise bookings data and particularly model the sales and cancellations of bookings over time to gain an understanding of buying behaviors as they relate to many datapoints, including:
- seasonality
- age of ship
- deck level
- proximity to stairs/elevators
- fore, aft, starboard, port sides of ship
- cabin/stateroom class
- cabin/stateroom rate
- booking type
- point-of-sale of booking
- channel partners
- occupancy of booking and room
- amenities such as window or balcony
This analysis allowed our whole team to gain a thorough understanding of typical buying habits, outliers, and also better understand how a better system may be able to identify problems before they occur.
04.
Sketches & Wireframes
Sketches and wireframes were able to be accomplished and approved in a fast two-week timeline. It was decided that user testing would be accomplished after the prototype build.
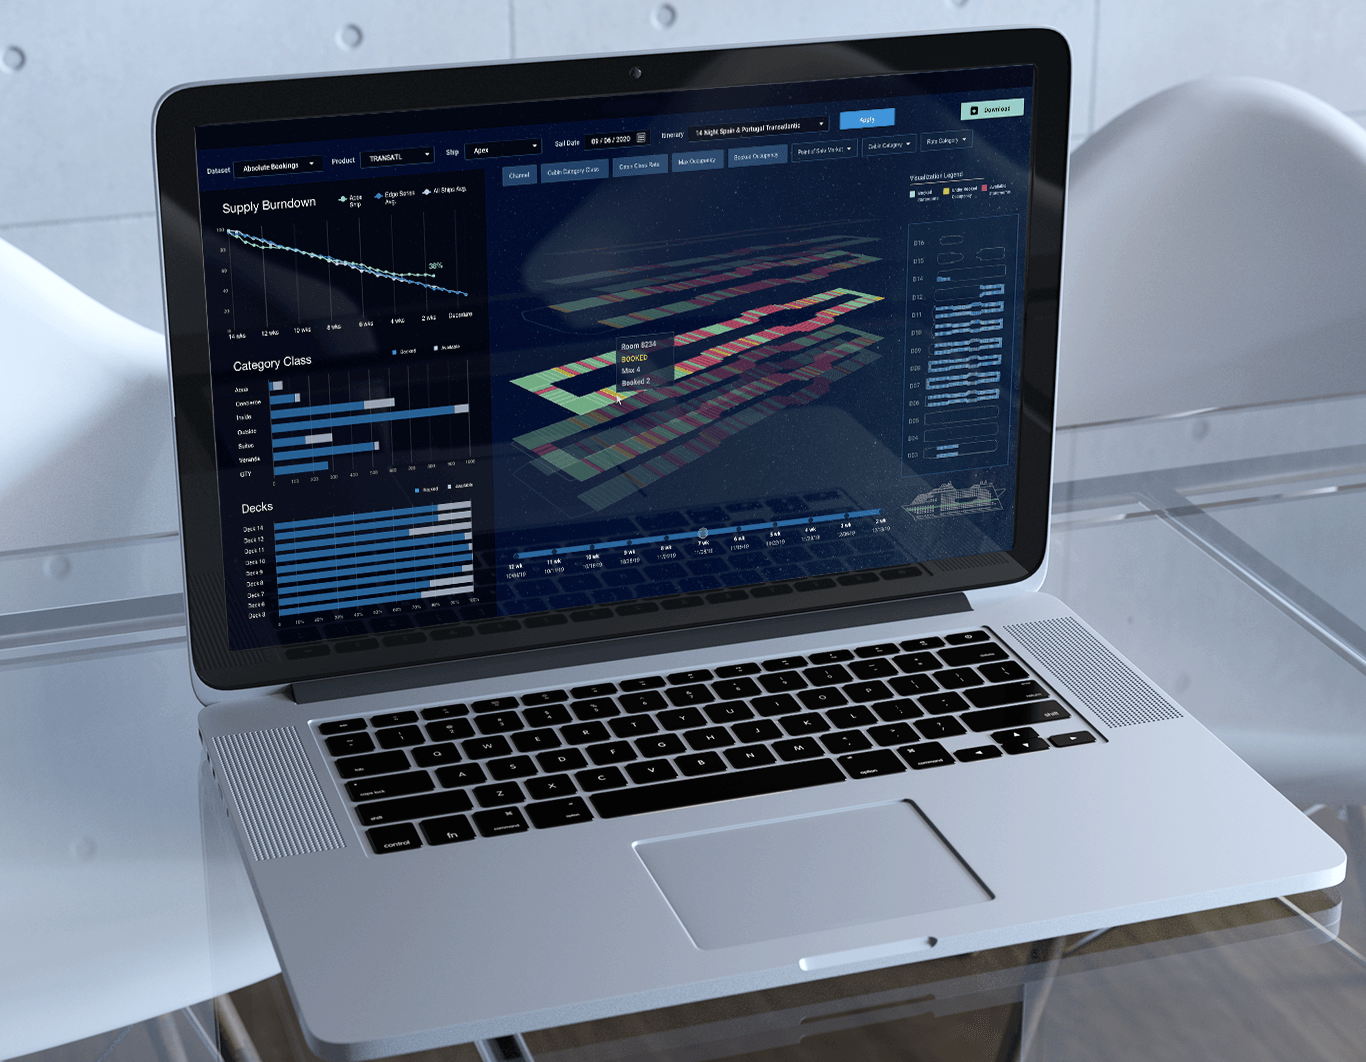
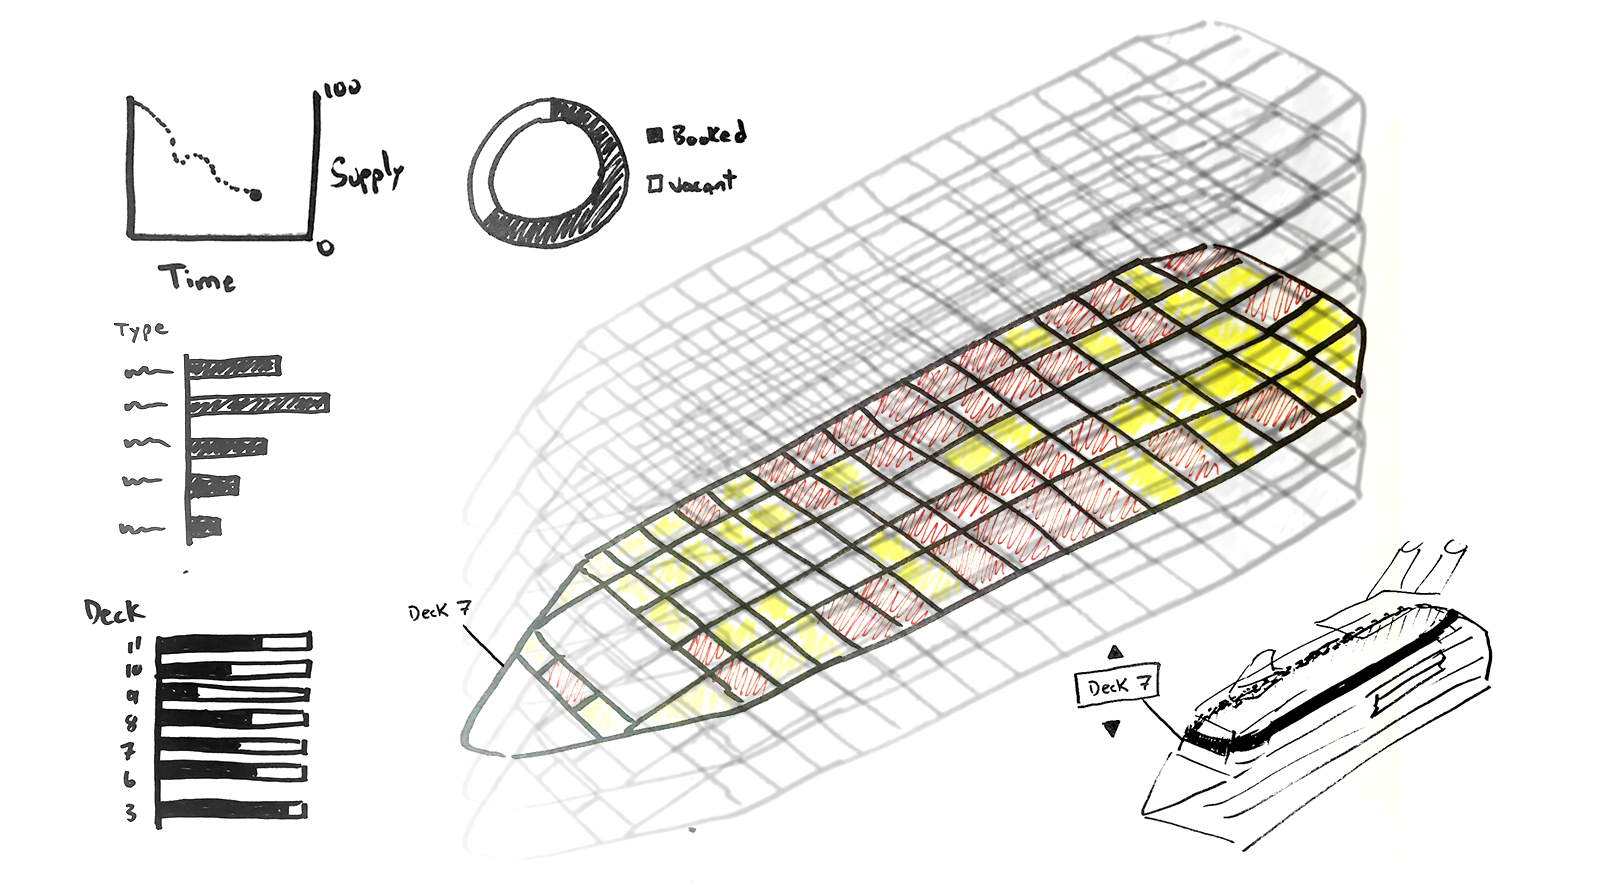
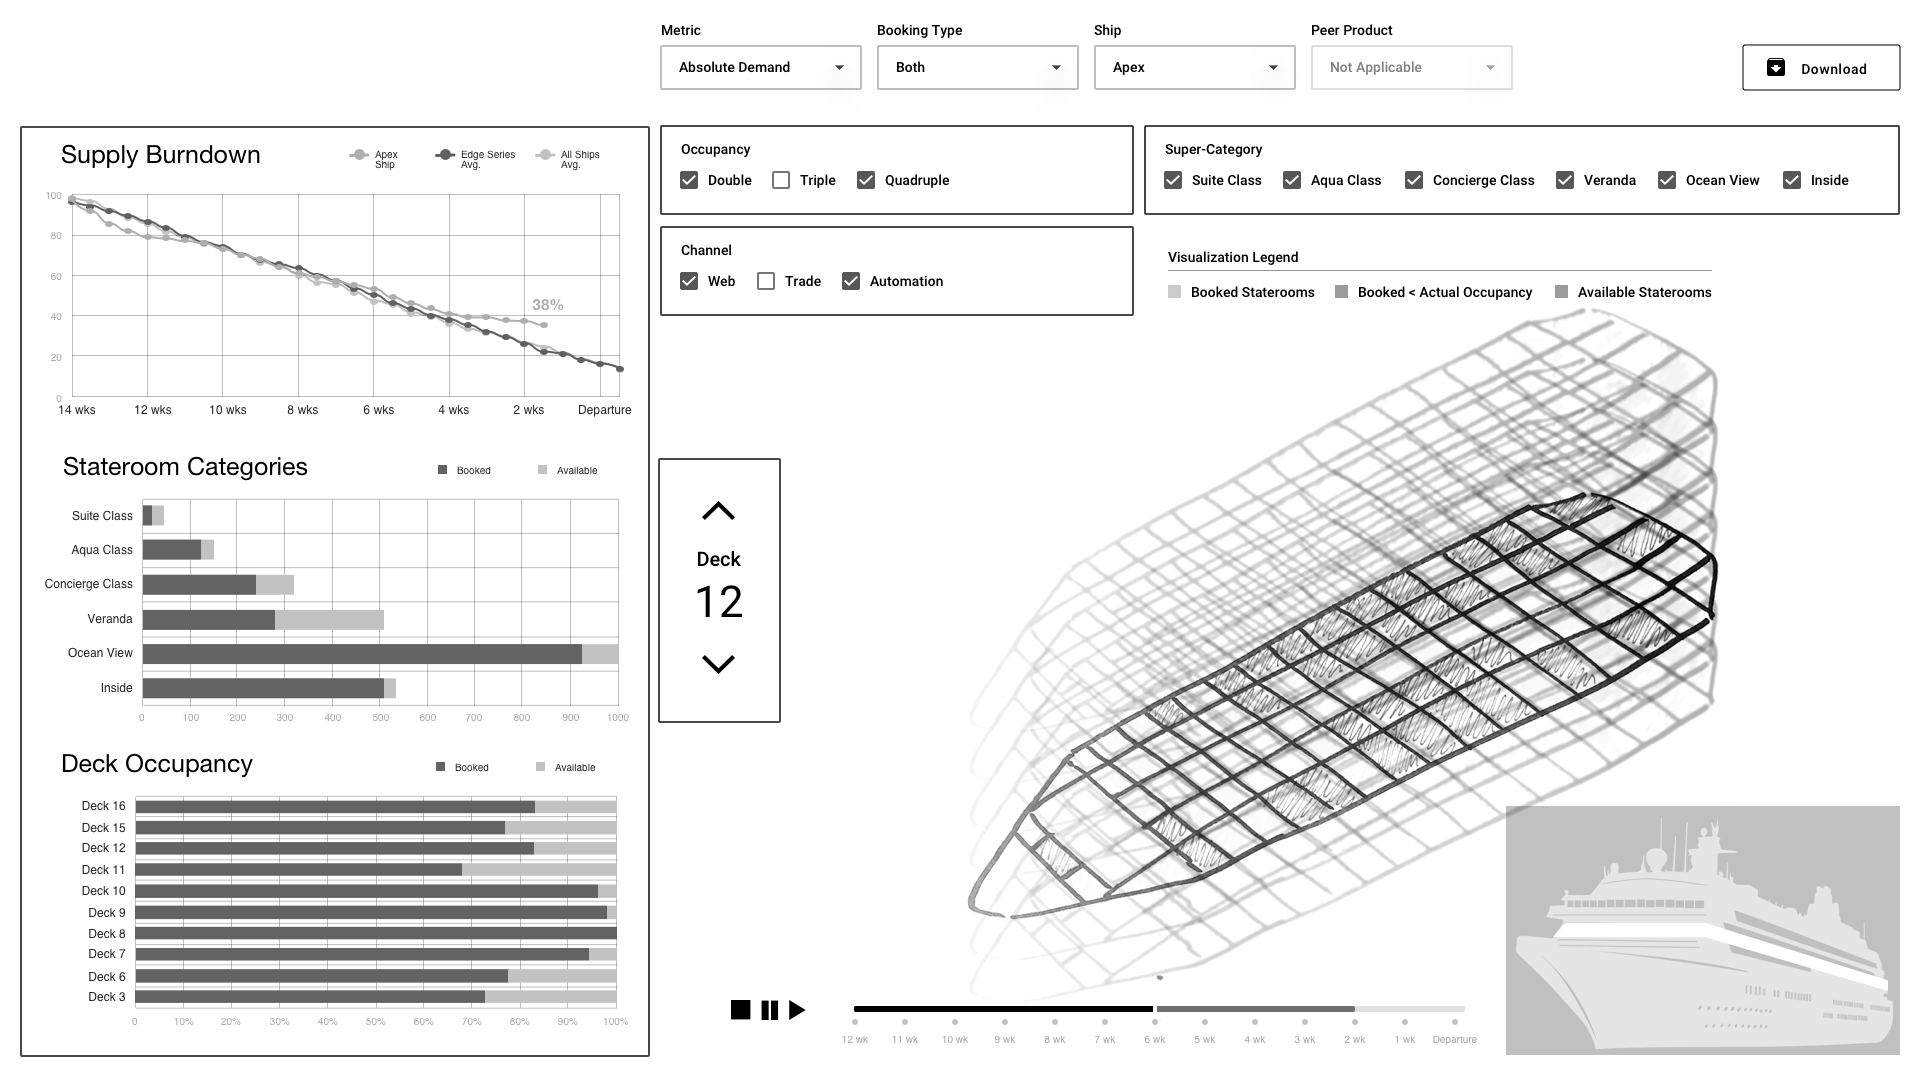
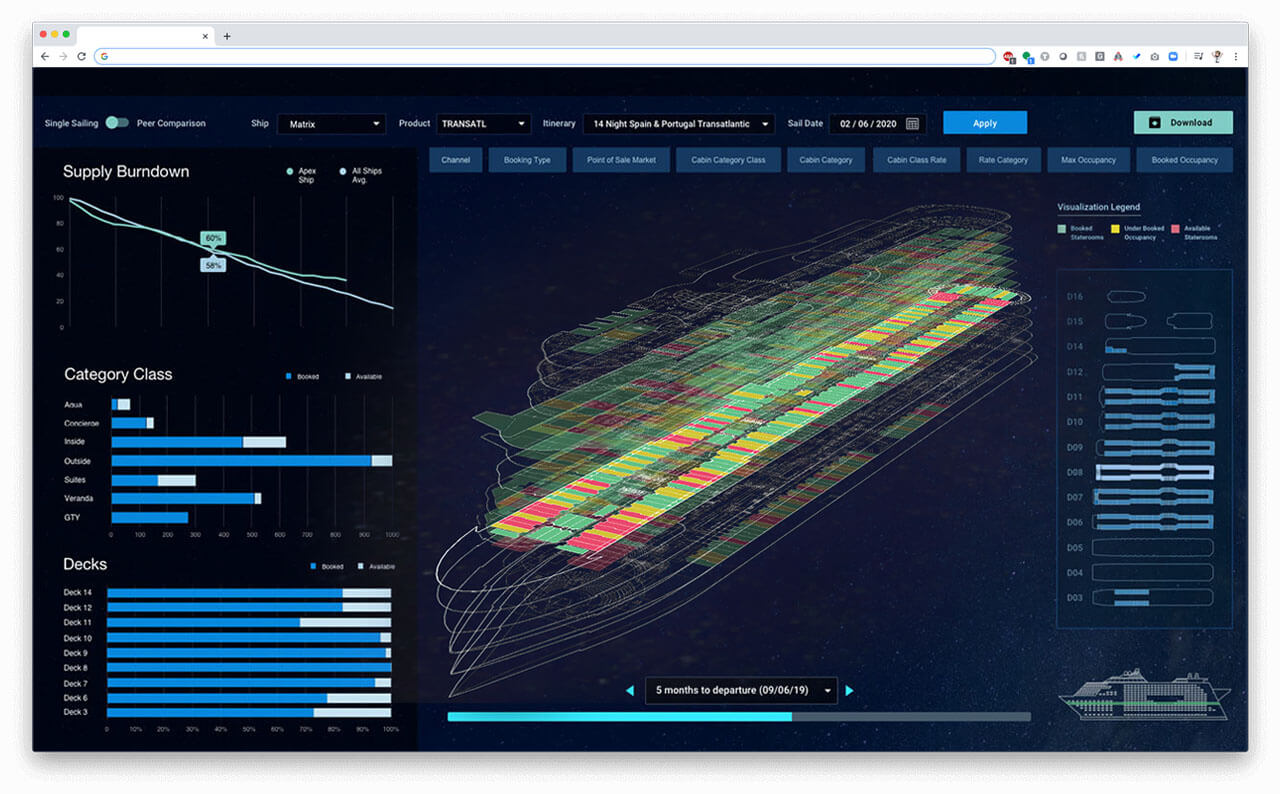
The wireframe introduced a 3-Dimensional ship. By default the tool would display the ship with the soonest upcoming sailing. Users could, of course, select a different ship and different sailings. The wireframe depicts the 3-D ship as a series of levels which can be navigated up or down by the user to view the patterns of stateroom bookings all at once, but also view one level in more detail at a time.
A supply burndown chart over time was depicted in the upper-left, revealing whether the ship’s bookings were on schedule with predicted data. Category and Deck were broken up in other charts. A series of filters lines the navigation pane and a “play” button allows the users to view stateroom bookings evolve over time through an animation effect.
05.
Design
The team designed and animated the prototype in Figma. The result was a successful interactive design for an internal dashboard application. Users could log in, see real-time updates to bookings for each cruise and sailing. In addition, data can be compared with the average bookings, or against peer groups of similar sailings. The pièce de résistance is a 3D rotating ship visualization showing individual staterooms and their booking status. Staff can now see clusters of unsold staterooms and manage pricing and deals across cabin categories, decks, and even target individual staterooms.
06.
Development
The development team had full reign of a custom stack to deliver the unique set of functionality needed for this prototype tool. The team chose to use Vue as the front-end framework and utilized Plotly, aka Dash for the data visualizations, which uses Python and integrated with the client’s AWS cloud VPC and ETL processes. Staff can now see clusters of unsold staterooms and manage pricing and deals across cabin categories, decks, and even target individual staterooms. User testing was underway as Covid wreaked havok on international travel. While revenues in the travel sector have been affected in recent years, efficiencies have been gained by utilizing this tool.