Using Location Demand Data to Find Investment Value
Project Brief
Commercial Real-Estate demand and opportunity are driven by many factors, including competition, talent, infrastructure, traffic, etc. A nation-wide commercial real-estate brand asked Boost Labs to simplify the commercial real-estate vetting process and make all these factors easy to access and understand where value exists for brokers, investors, building owners, and business owners. The goal was to extend the brand’s already useful data to serve a changing demand in post-covid commercial real-estate and establish a platform which could be enhanced to serve any vertical.
“This has been a massively beneficial partnership”
— client testimonial
Capabilities Delivered
- Product Strategy
- Business Intelligence
- User Research
- UI/UX Design
- Rapid Prototyping
- Data Visualization
- Reporting
01.
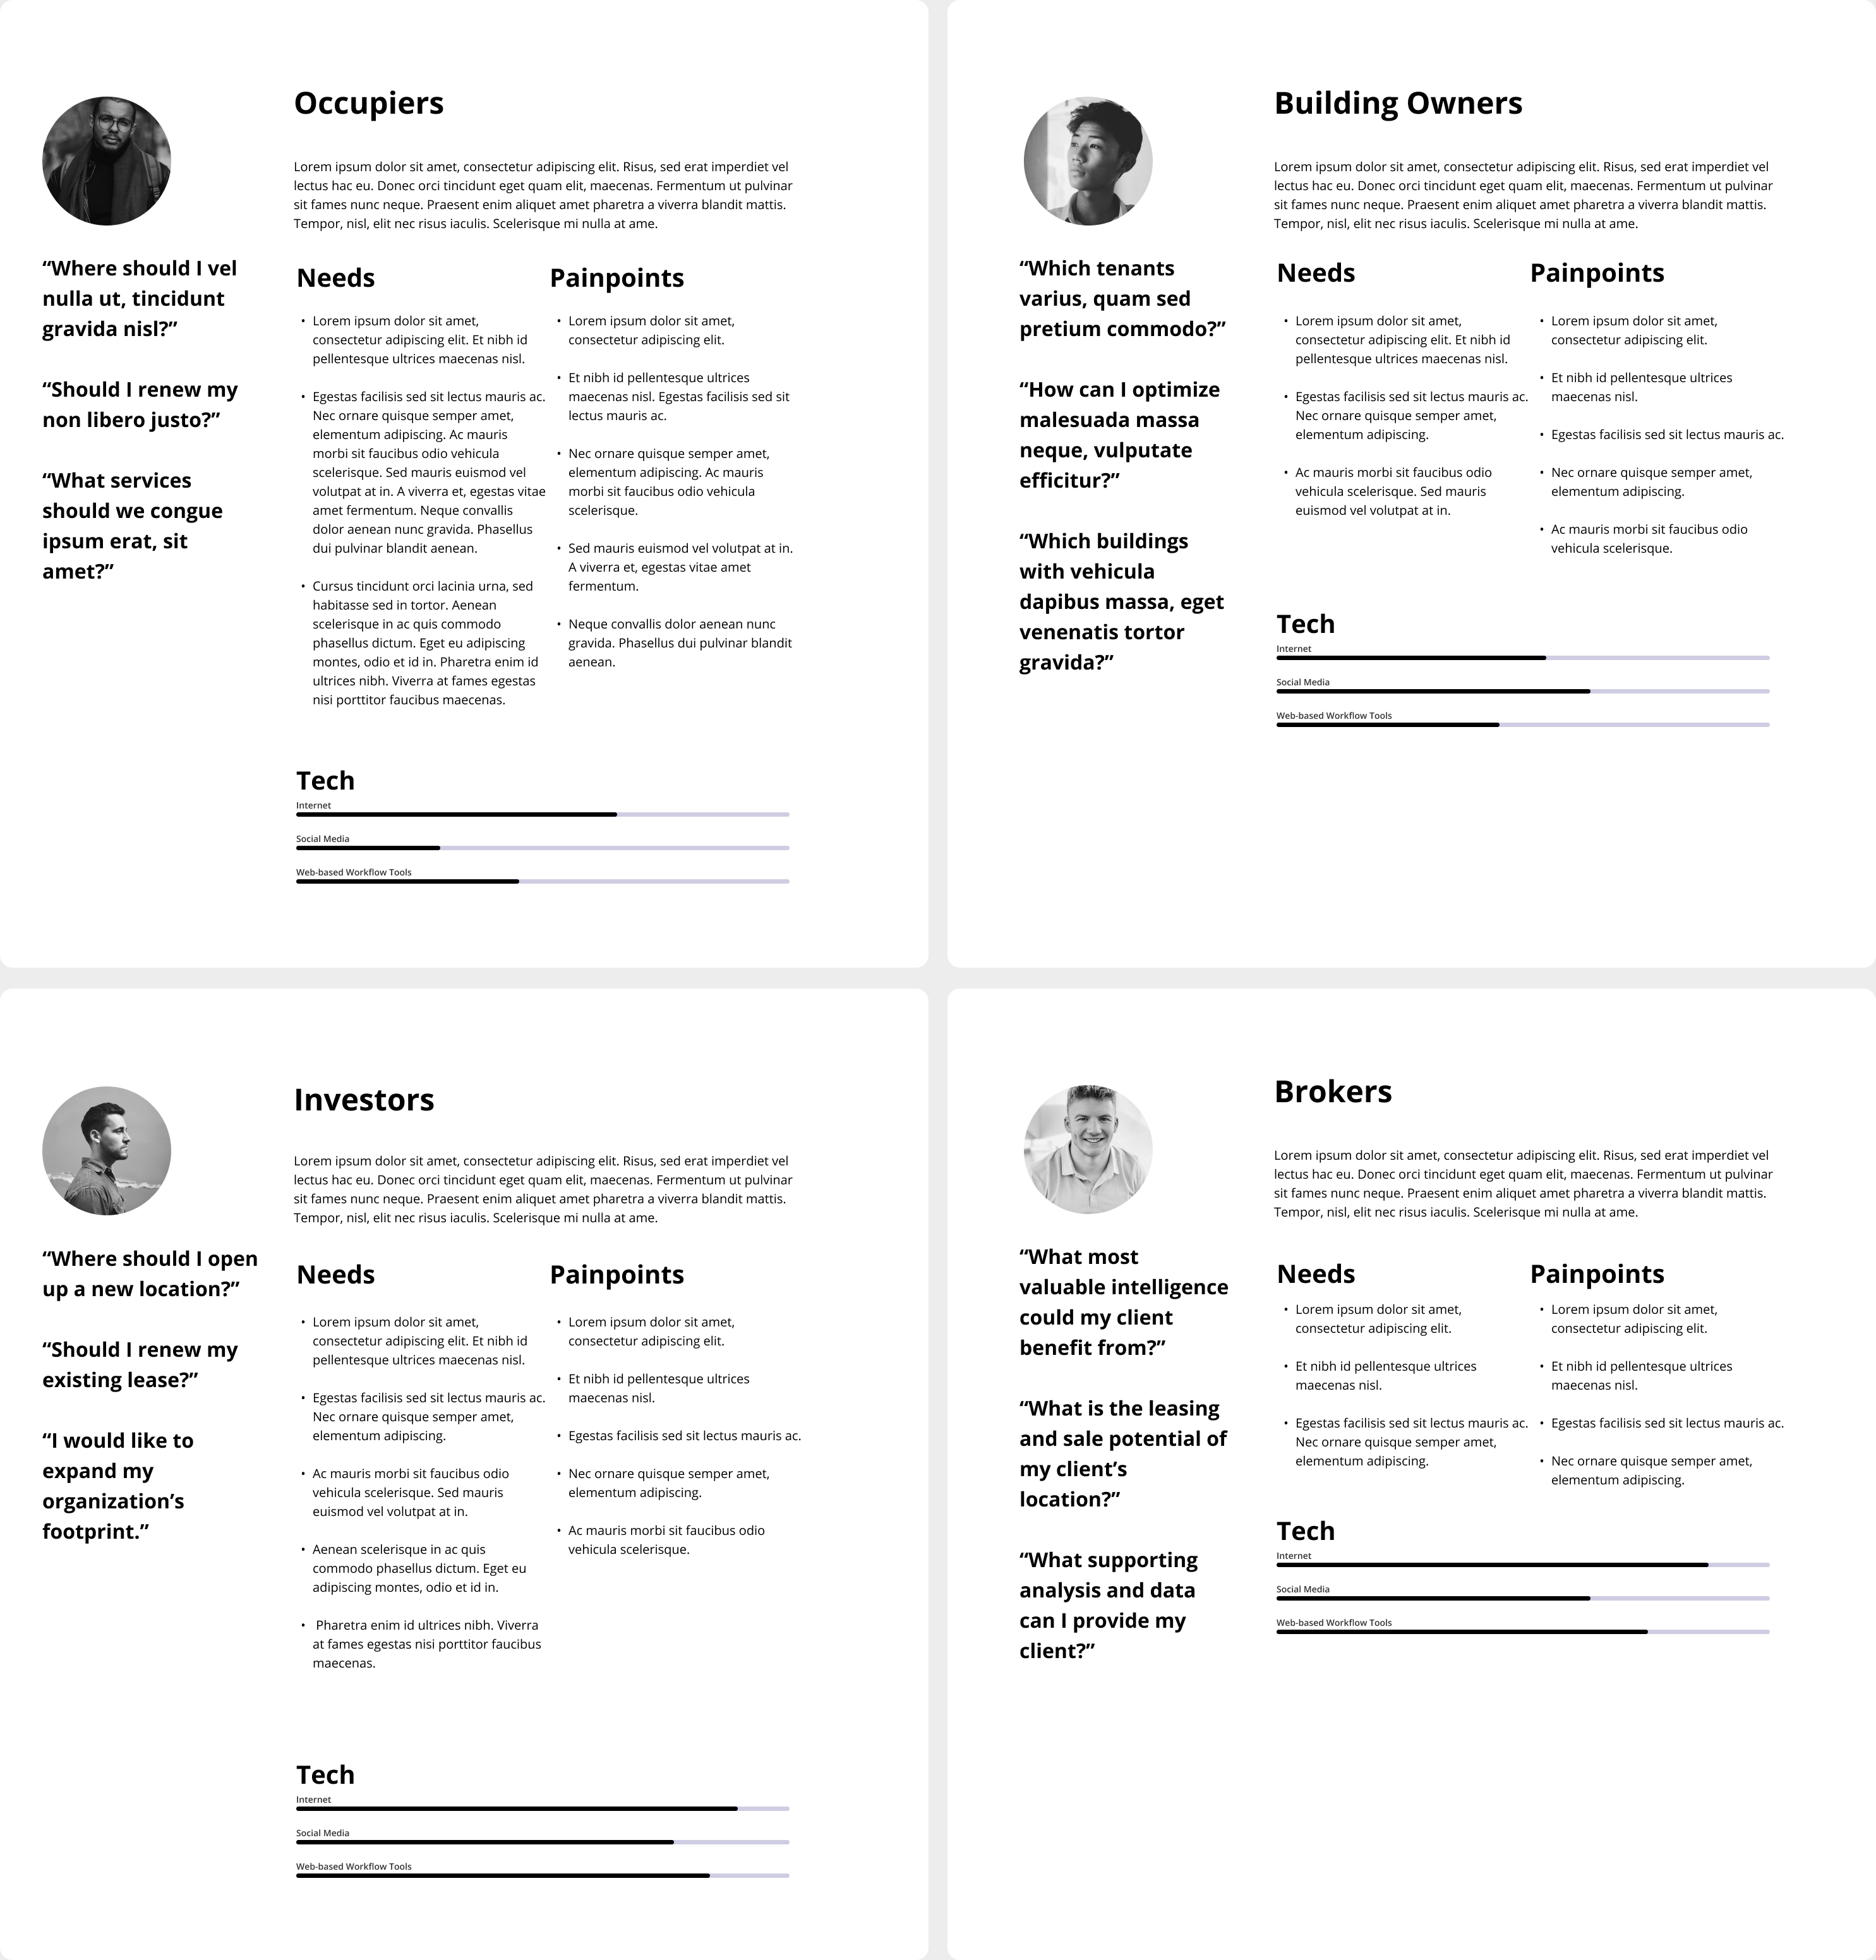
The Audience
We began by understanding the target audience, their needs and pain points, preferred technologies, desired outcomes, and motivations through interviews and key stakeholder input. We defined four user personas as the target audience of this product. This research paints a picture from which our team can empathize and make critical decisions that always benefit the user and fit into their way of doing business.
02.
User Journey
As the Boost Labs team empathizes with the target audience, we work backward from the desired outcome to identify all the steps and inputs needed to reach that outcome. We conducted business intelligence research with the help of subject matter experts, and identified seven main categories of possible inputs and then focused on how to make them as intuitive yet rich with capability as desired.
03.
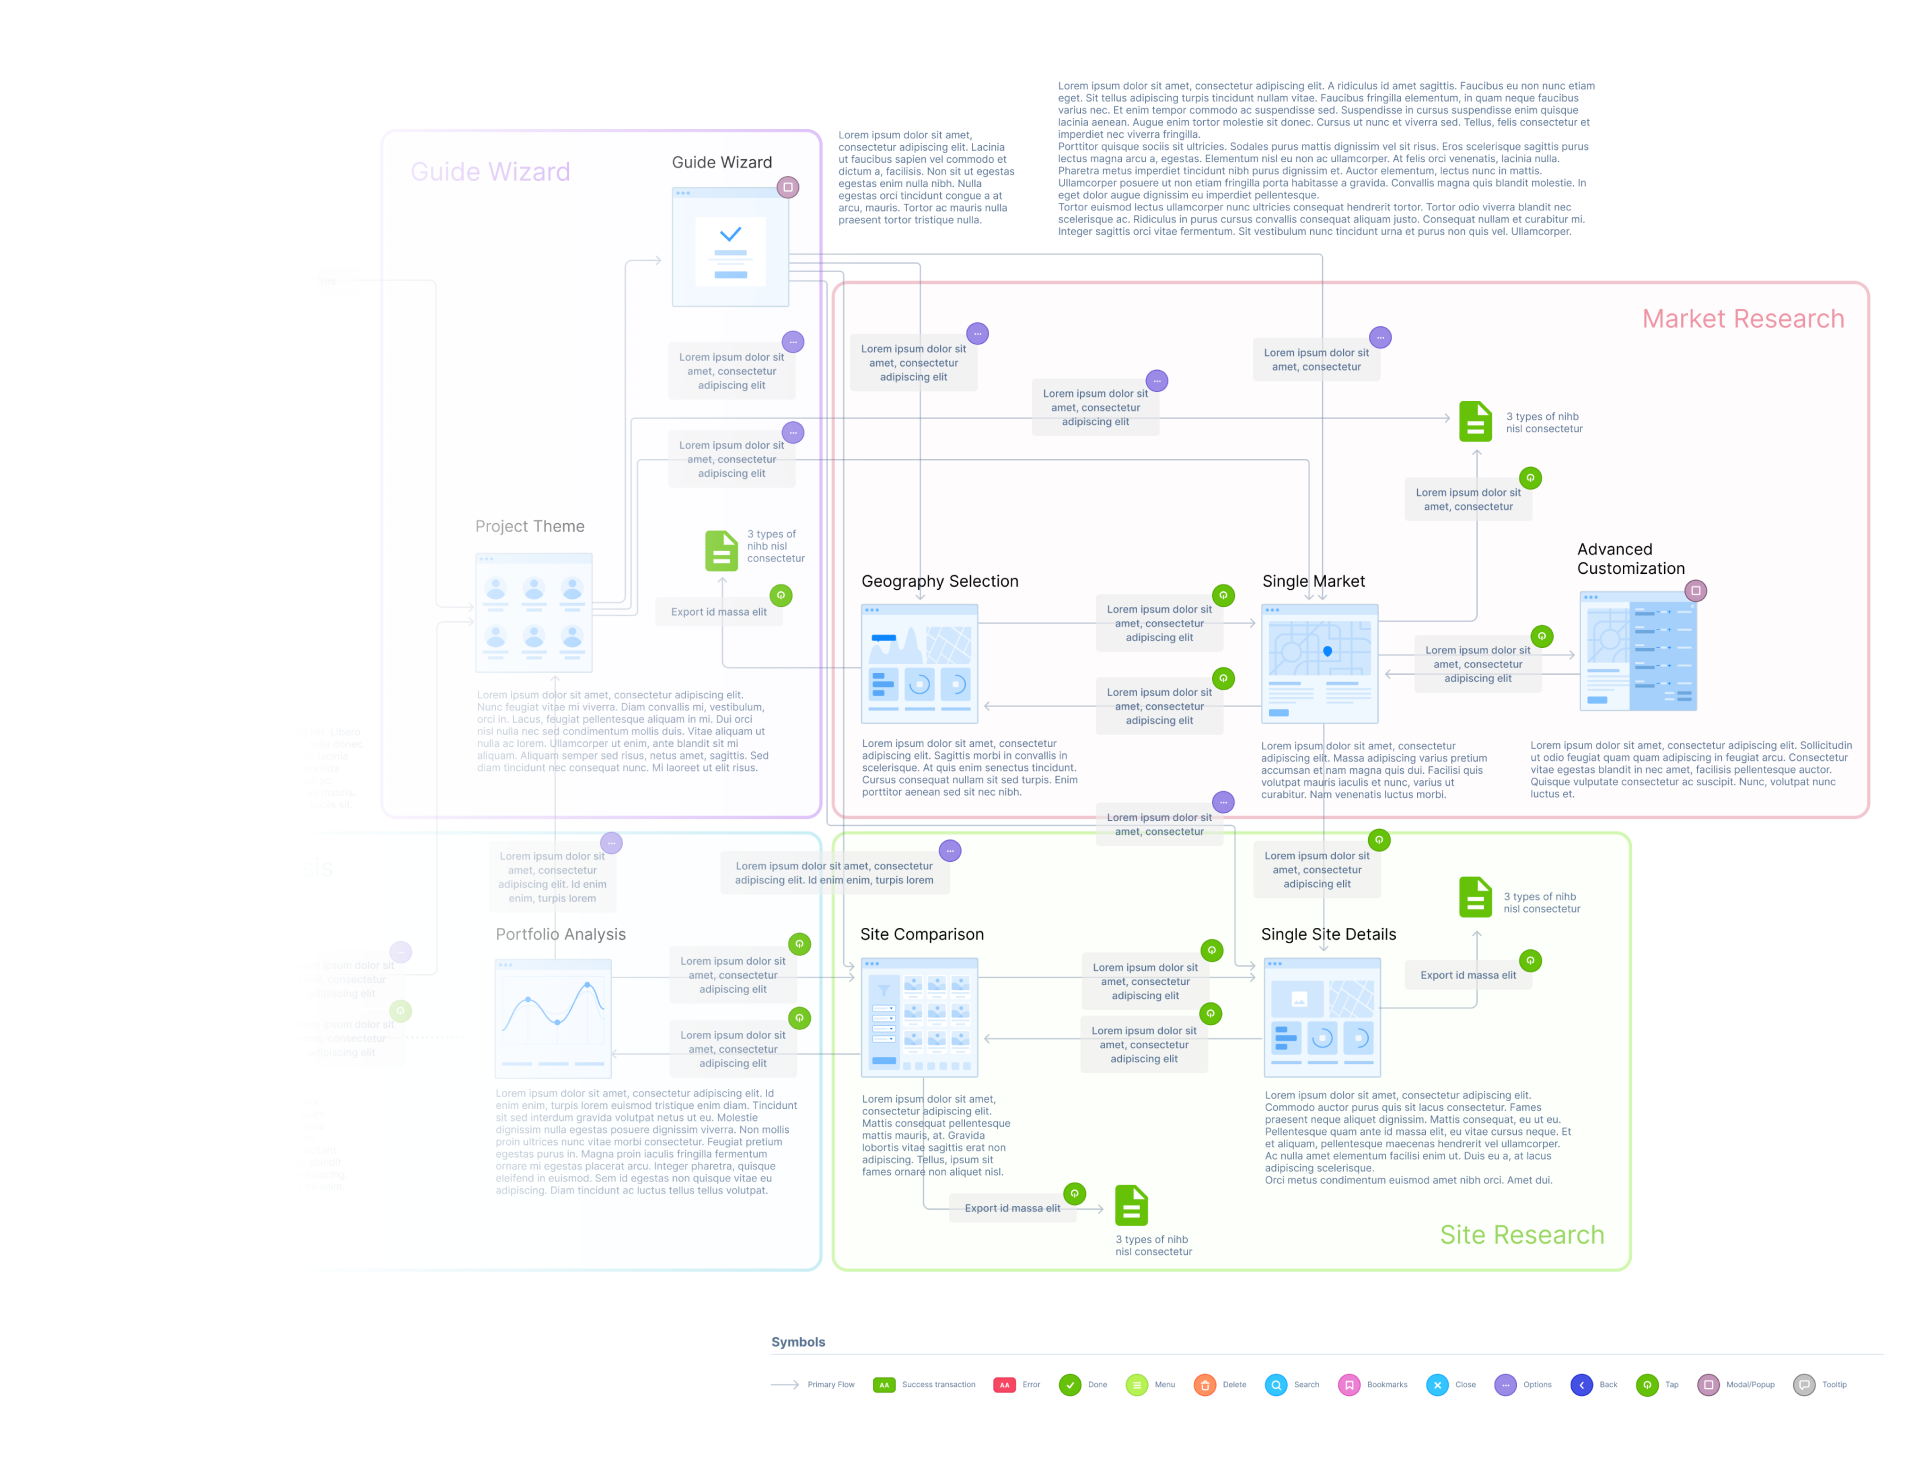
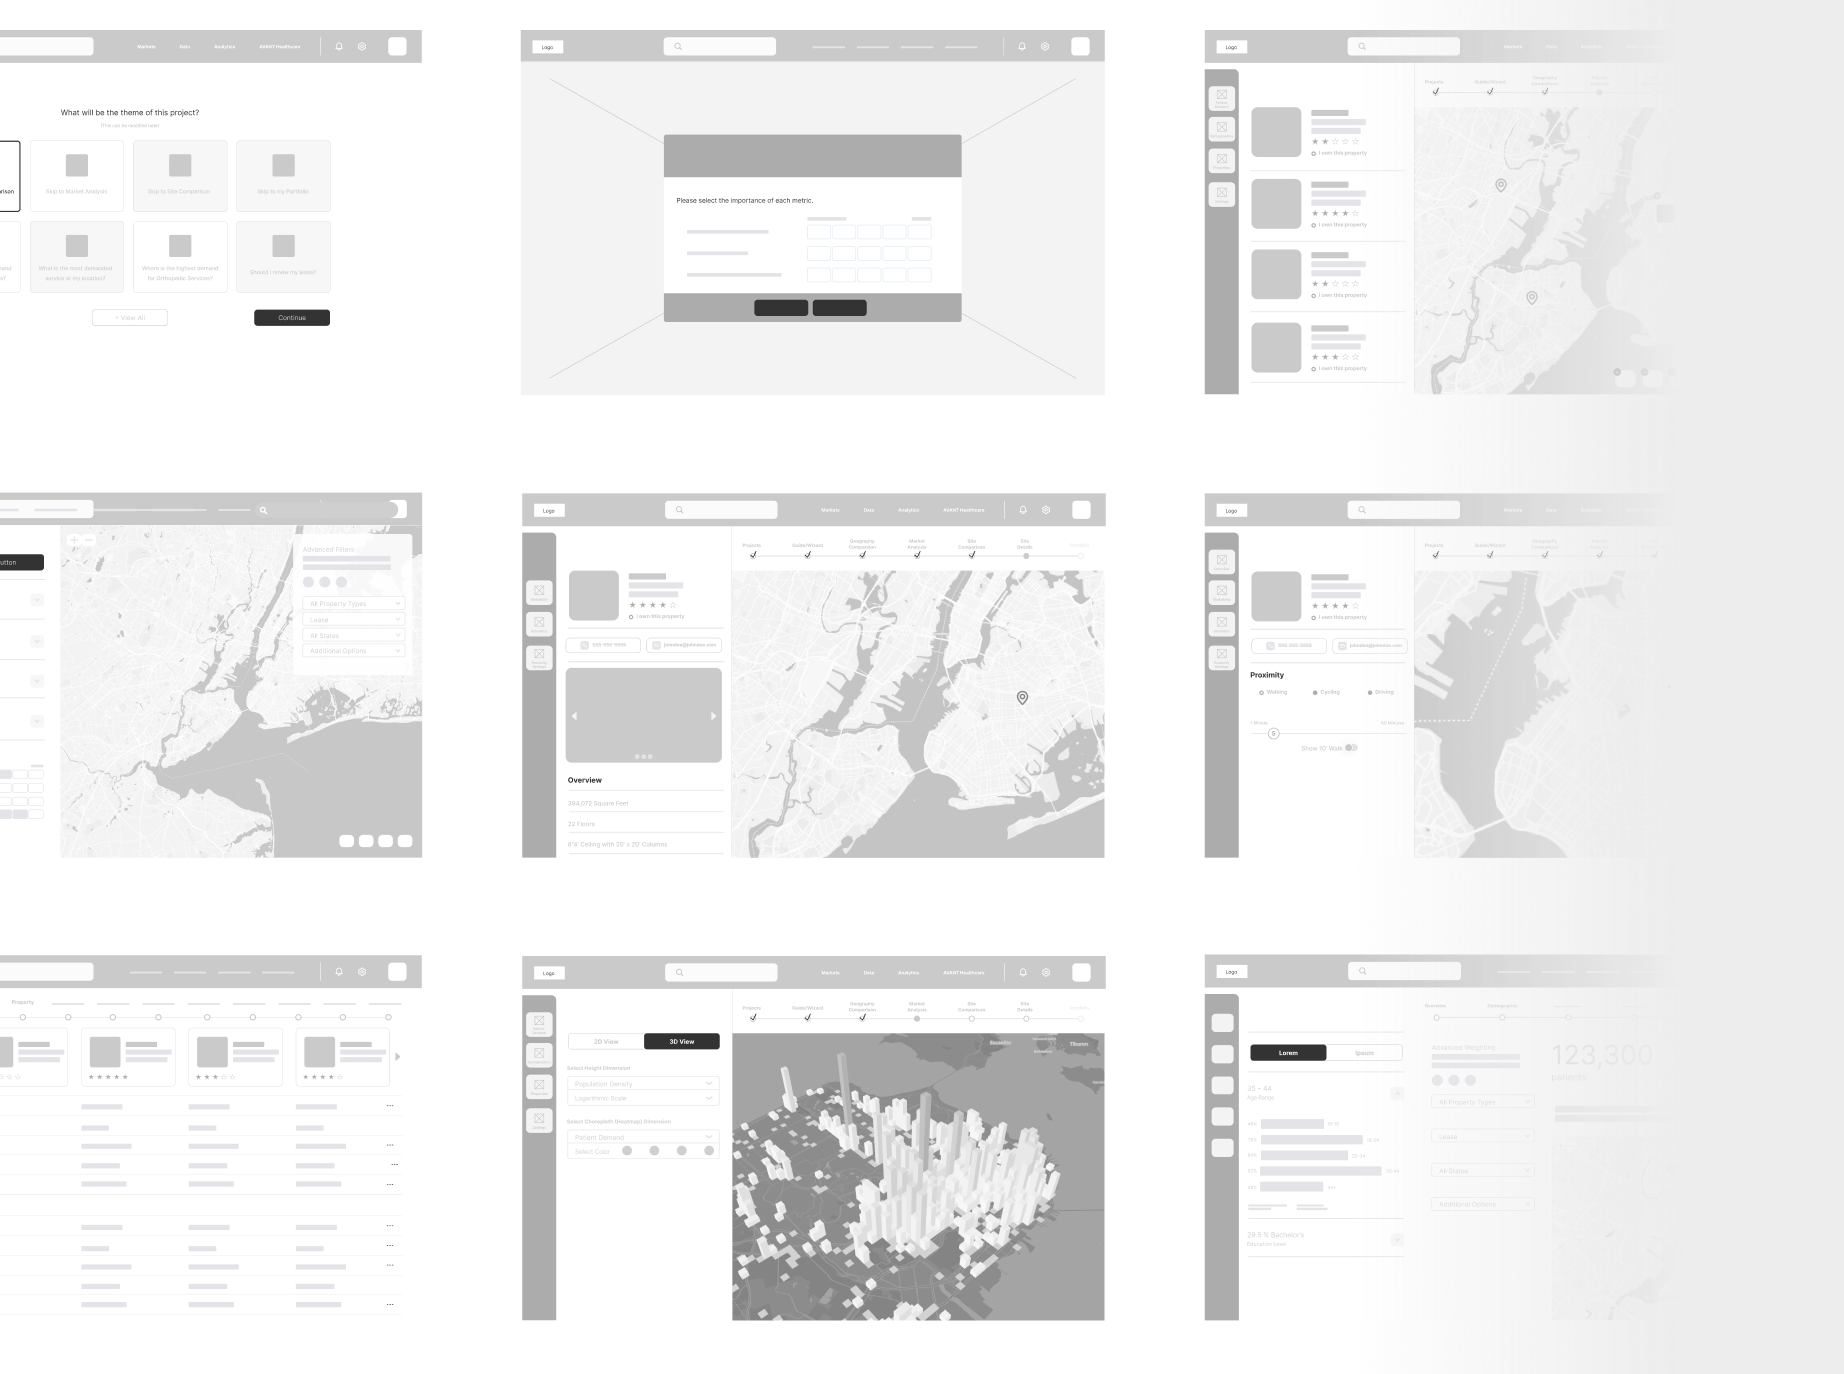
Wireframes
Iterative wireframes are a pivotal step in the user experience (UX) design process toward a well-thought-out intuitive application. This step requires curiosity, creativity, and a desire and openness to explore new ideas. The team captured iterative stakeholder and user feedback to ensure wireframes evolved into functional designs which are cohesive and delight users. Not every wireframe evolves into the next stage of the product, but those that do undergo tweaks and improvements until it is ready for design polish to become customer ready.
By the end of the fourth week of the project, a set of 24 wireframes had been iterated and paired down to 9 wireframes necessary to complete each user workflow. These vetted wireframes summarized the business needs, data stories, and features required.
04.
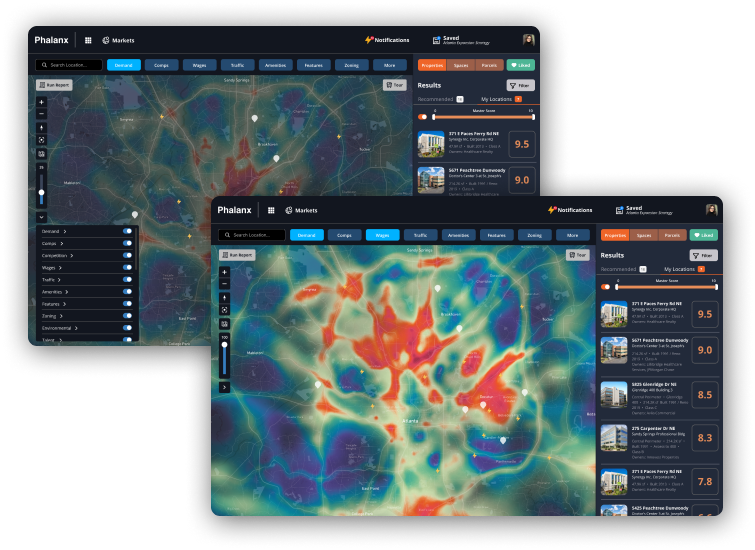
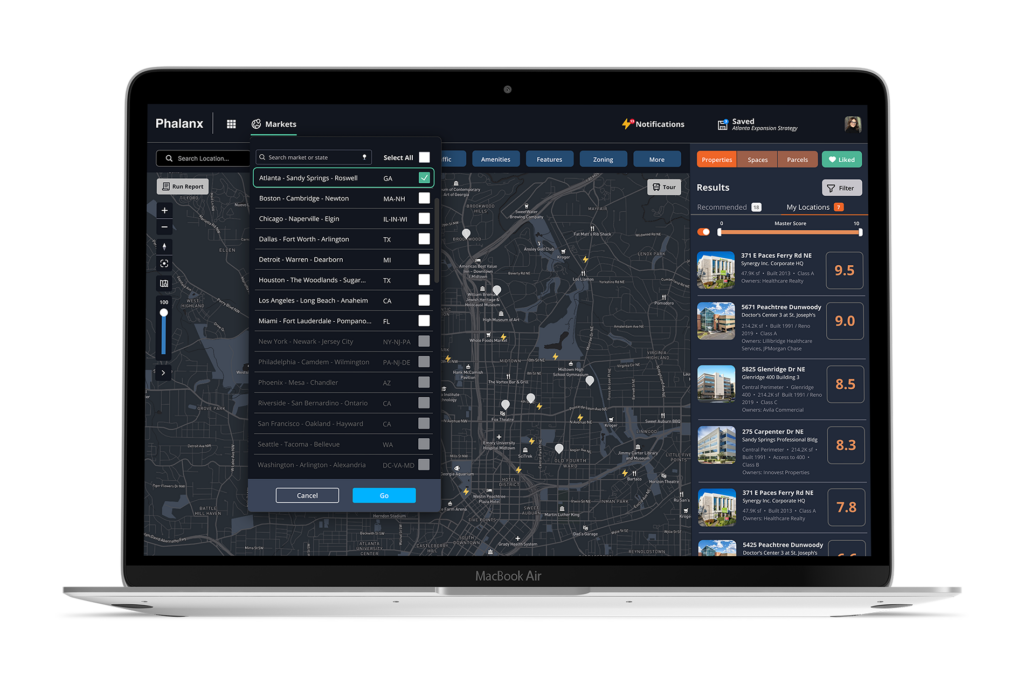
Rapid Prototyping
Static designs never convey the depth of a true application so our creative team designed and iterated interactive mockups in Figma. This allows sharing clickable prototypes rich with multiple workflows in order to simulate a functioning application to align stakeholders and solicit critical feedback, ultimately reaching a cohesive and complete set of designs.
Prototyping this product took six weeks, and involved 60 interactions.
Clickable Interactions
A key differentiator is our ability to analyze and distill complex data to produce data products
05.
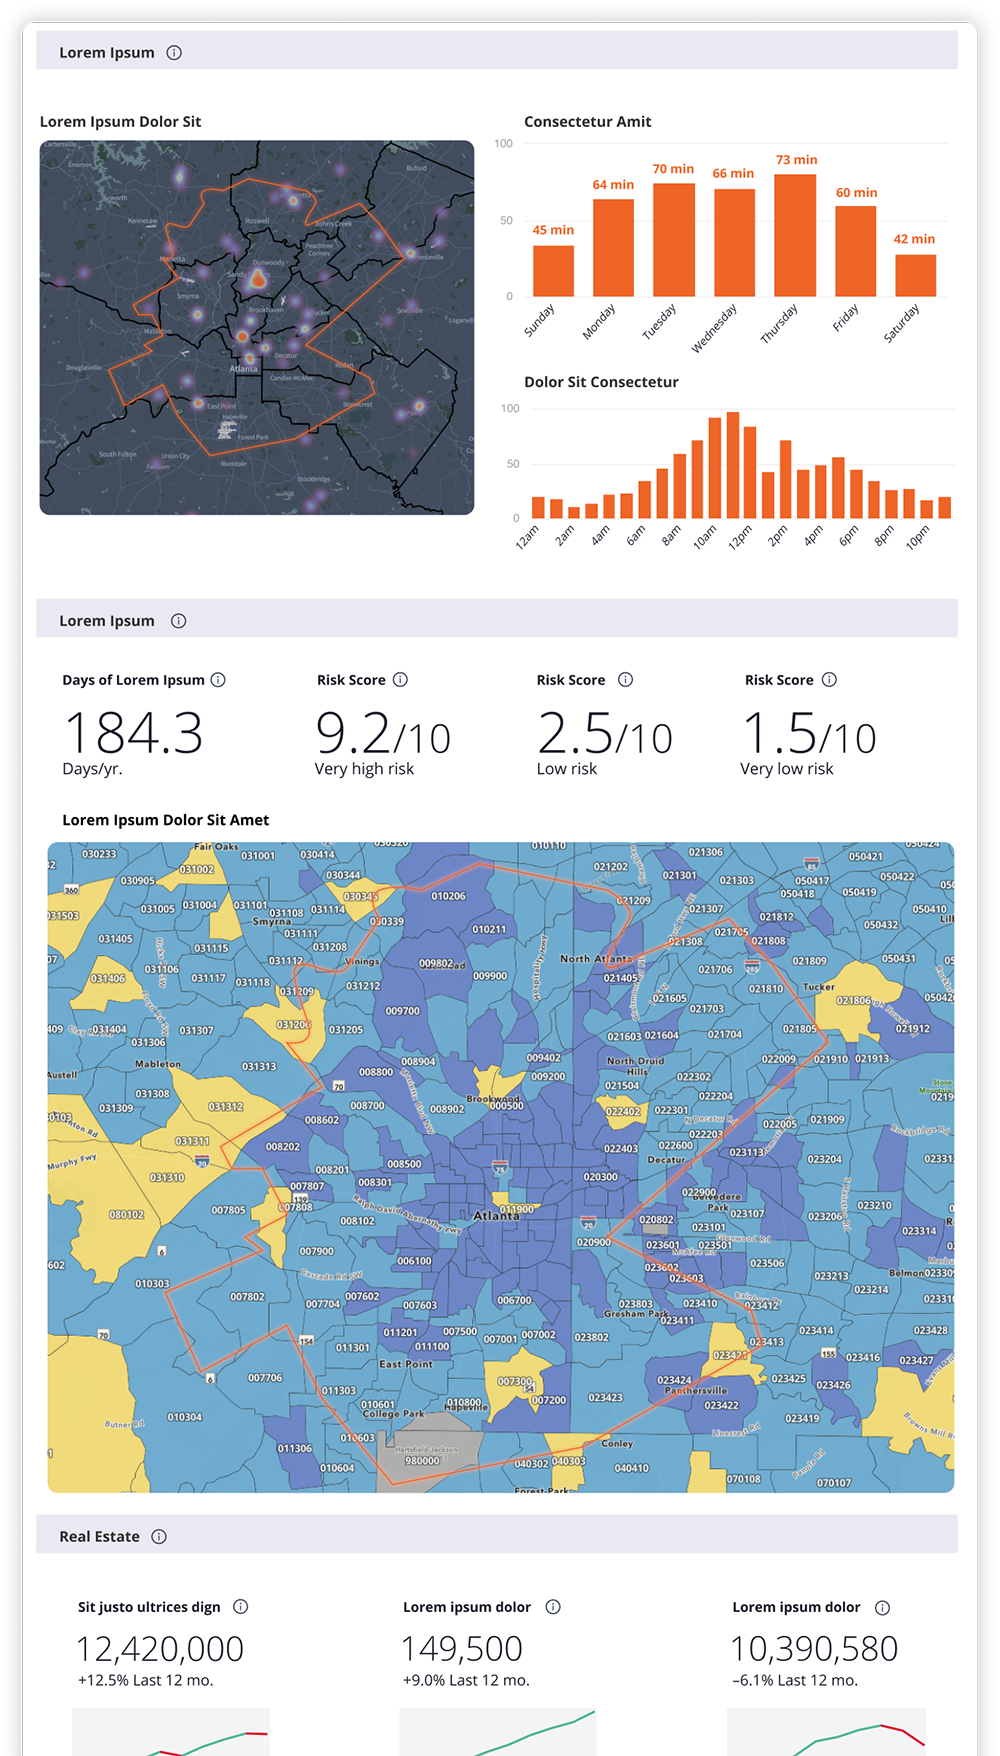
Report Generation
Functionality to view up-to-date data and also export it as a link, .PDF, .PPT, .XLS, or .CSV is an essential requirement we heard from users. Reports were designed by our team to allow investors, brokers, and occupiers quick access to present compelling support data to clients, teams, and across organizations. Reports were designed to be hierarchical, provide context, and rank relevant listings. These reports were designed to be flexible, allowing customized criteria such as a selected market, a select set of properties, demand score, traffic preferences, amenities, etc.